Present Key Insights with Customizable Segments
Product Description
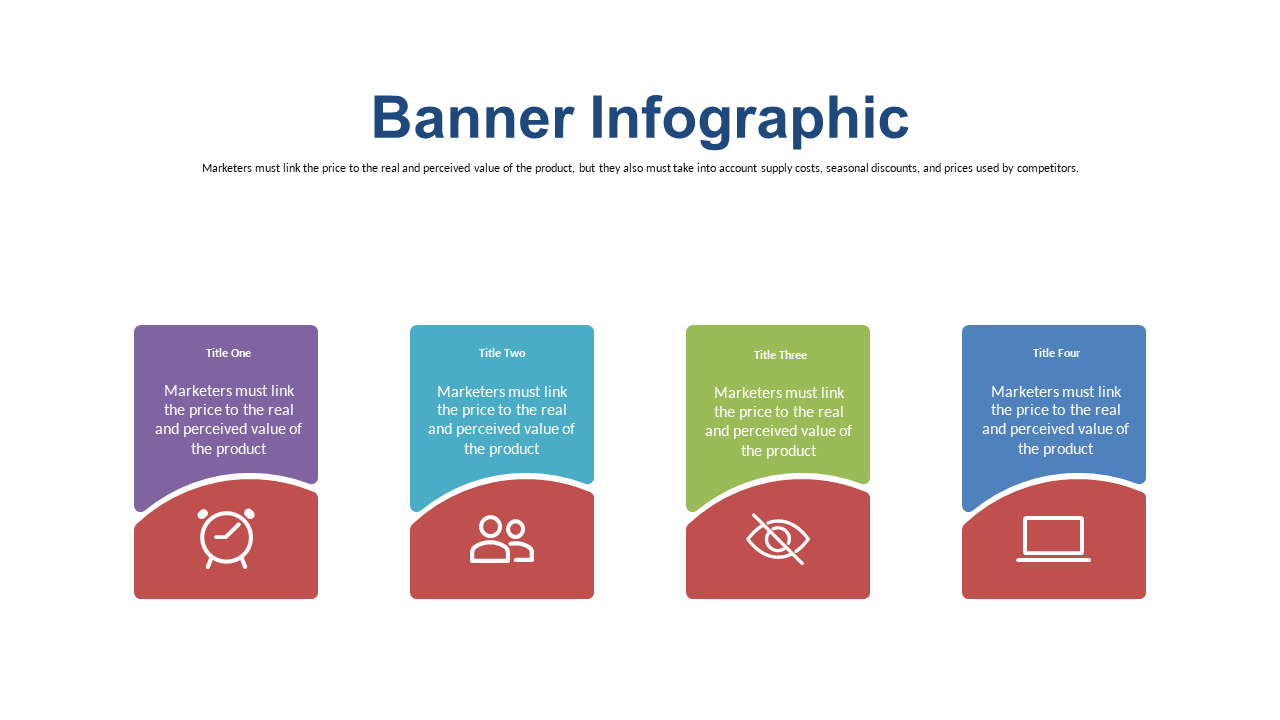
In a fast-paced business landscape, communicating key insights effectively is more important than ever. This slide addresses that need by allowing you to break down complex data into four distinct segments that are visually compelling and easy to understand.
Business analysts preparing reports or team leaders summarizing project progress will find this slide particularly useful. It also serves well in strategy sessions where clear, visual representations of data are needed to guide decision-making processes.
For only $0.99, you can get this slide instantly downloaded and ready to edit in PowerPoint or Google Slides. Customize it effortlessly, and you’ll have a powerful presentation tool in just a few minutes.
$0.99 – Purchase Checkout
Added to cart







