By Category
💼Business 📊Infographics □Minimal 🕐Timelines ✨Neumorphic 🗑Diagrams 🔄Flow Charts ✨Glassmorphism 🎨Creative 🌍Abstract 🔄Cycle Diagrams 💎Isometric 🖼Illustrations 📱Social Media 🗺MapsBy Slide Type
🚀Pitch Deck 📌Roadmap 🔍SWOT Analysis 📅Timeline 📈Gantt Chart 🏢Org Chart 📋Funnel ⚖Comparison 📄Case Study 📋Agenda ⭐Icons & Lists 👏Thank YouBusiness & Strategy
💼Business Strategy 📣Marketing Strategy 🎯Sales Funnel 💡Startup 💰Finance & Budget 🔍Market Research 📈Growth Strategy 🗺️Customer Journey 📋Project Management ⭐OKR & Goals ⚖️Risk Management 👥Team & HRSlide Types
📊Infographics ⏱️Timeline 🔄Process Flow ◇Diagrams 🔁Cycle Diagrams 📉Charts & Graphs ☰Lists & Comparison ⚖️SWOT Analysis 🗺️Roadmap 🏢Org Chart 📅Gantt Chart 🔀Flow Charts 📈KPI & Metrics 📋Agenda ✨Icons & Graphics
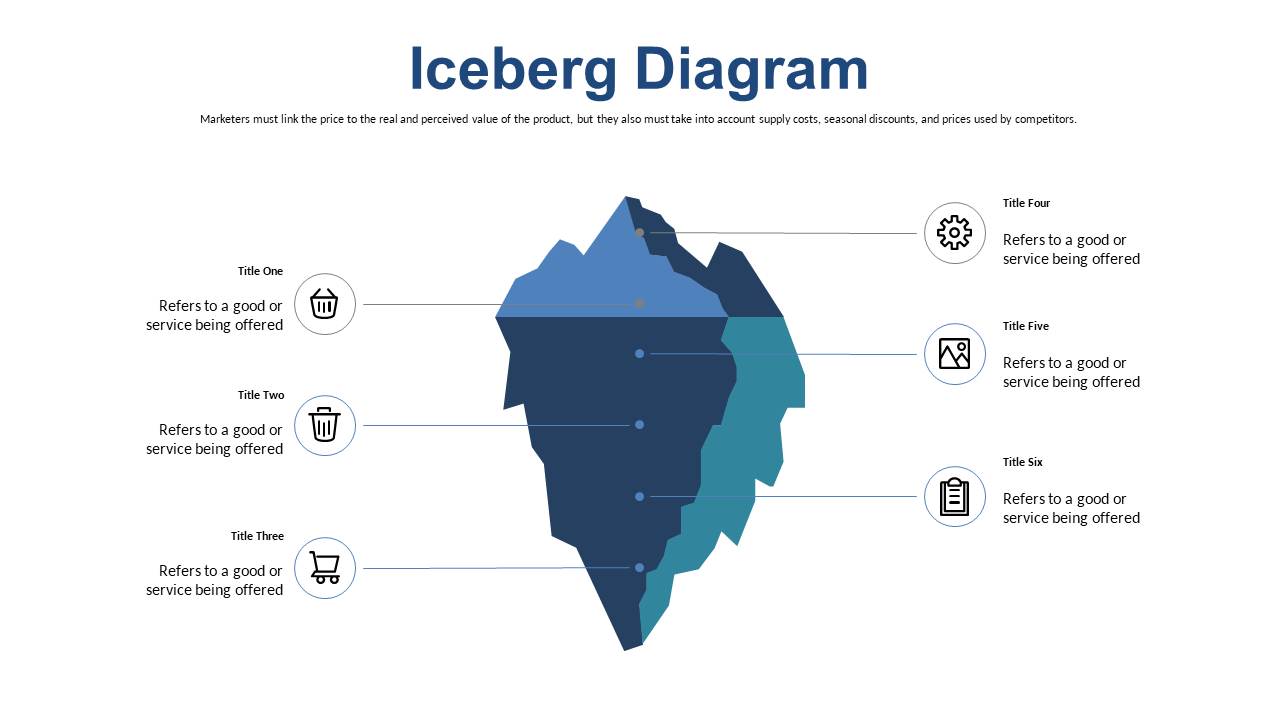
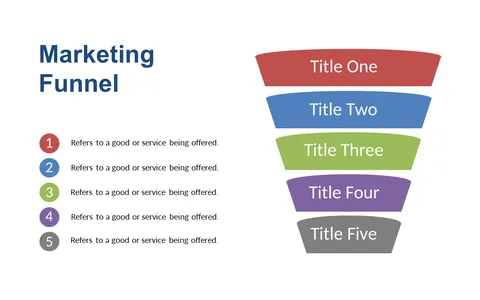
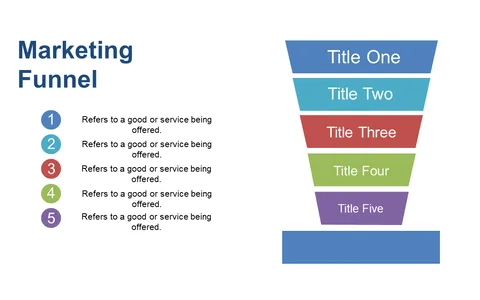
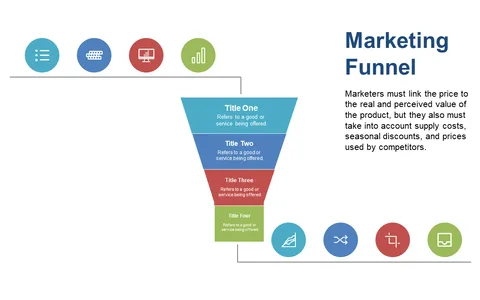
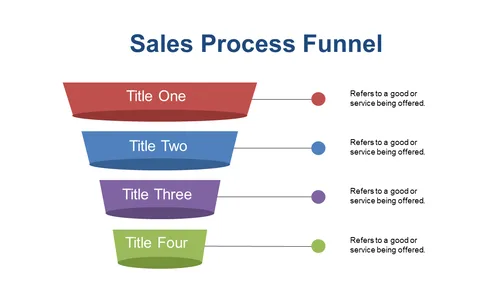
Presenting complex data can often feel overwhelming, especially when you’re trying to convey essential insights in a way that’s easy for your audience to grasp. You need a solution that not only organizes your information clearly but also engages your audience without distraction. This polished funnel infographic template is designed to simplify your data visualization while maintaining a professional appearance.
This template is perfect for business analysts presenting sales funnels, marketing managers showcasing customer journeys, or project leads discussing workflow pipelines. Whether you’re in a corporate meeting or sharing your insights over Zoom, these slides help convey your message clearly and effectively. With a clean design and ample space for customizing your content, this template fits seamlessly into any business context.
In this download, you’ll receive 20 well-crafted slides that highlight various stages of a funnel, ready for your specific data. Editing is a breeze, allowing you to make adjustments that suit your presentation needs. At just $3.99, you can have this powerful tool ready to go in just minutes, making it a smart choice for your next project.
🛡 7-Day Money-Back Guarantee
Yes — every element in the Data Visualization slides including text, colors, icons, shapes, and layouts is 100% editable in Microsoft PowerPoint 2016 and above. No design skills or additional software required.
Yes. Import the downloaded Data Visualization PPTX file into Google Slides from Google Drive. All layouts, fonts, and formatting transfer correctly — no manual fixes needed.
You get one fully editable PPTX file (Light theme) — downloadable immediately after payment. No subscription, no waiting. Open it in PowerPoint or Google Slides and start editing right away. A full PDF preview of all slides is also available before you purchase so you know exactly what you are getting.
This template includes 20 professionally designed Light theme slides. Each slide covers a different layout so you can pick exactly the ones that fit your presentation without redesigning anything from scratch.
Library Decks are curated slide collections focused on one specific use case — no filler slides, just the exact layouts you need. Every slide in this deck is directly usable for Data Visualization presentations without editing around off-topic content.
Yes — all charts in these Data Visualization slides are native PowerPoint charts. Double-click any chart to open the built-in data editor and enter your own numbers. Bar charts, line graphs, pie charts, and scatter plots are all fully editable.
Yes — your $5.99 purchase includes a full commercial license for the Data Visualization template. Use it for client presentations, business pitches, agency projects, and paid work with no attribution or royalty requirements.
Contact us and we will fix it within 24 hours — whether the file is not downloading, not opening, or not matching what you saw. Before purchasing, you can also preview every slide as a PDF so there are no surprises. If we cannot resolve the issue, we will make it right.