
Some Processes Don’t Have a Beginning or
End — And Your Slide Should Show That
A flowchart has a start and a finish. A timeline
has a beginning and an end. But some business
processes are continuous loops — they repeat
indefinitely, and showing them as a linear sequence
actually misrepresents how they work. The PDCA cycle
doesn’t end at “Act” — it loops back to “Plan.” The
product development cycle doesn’t end at “Launch” —
it circles back to “Research.” When your process is
circular, your diagram should be too.
Cycle diagram PowerPoint templates give you a
ready-made circular layout that immediately
communicates continuity, repetition, and
interdependence — without building the shape
manually in PowerPoint.
5 Business Processes That Need Cycle
Diagrams (Not Flowcharts)
1. PDCA Cycle (Plan-Do-Check-Act)
The foundational quality improvement loop used
across manufacturing, operations, Six Sigma, and
management consulting. PDCA is arguably the most
universally recognized cycle diagram in business —
if you’re presenting to a US corporate or operations
audience, they’ll recognize it immediately. A clean
4-step circular layout with equal-weight segments
is the standard format.
2. Product Development Cycle
Research → Design → Build → Test → Launch →
Analyze → back to Research. This cycle is central
to agile development, SaaS product teams, and
startup pitch decks. Showing it as a circle —
rather than a straight line ending at “Launch” —
communicates that your team thinks in iterations,
not one-time projects. US tech and product
audiences respond strongly to this framing.
3. Marketing Campaign Cycle
Plan → Create → Distribute → Measure → Optimize
→ back to Plan. Every marketing director presenting
to a US executive team needs to show that marketing
is a data-driven loop, not a series of disconnected
campaigns. A cycle diagram makes the feedback loop
visible — and makes the case for ongoing budget
more intuitively than any table of metrics.
4. Annual Business Planning Cycle
Review → Strategize → Budget → Execute → Measure
→ back to Review. Used in board presentations,
executive offsites, and annual planning decks.
Shows stakeholders that strategy isn’t a one-time
event — it’s a recurring discipline. Particularly
effective for US Fortune 500 and mid-market
corporate presentations.
5. Customer Success Cycle
Onboard → Activate → Engage → Renew → Expand →
back to Onboard. The customer success cycle is
central to SaaS and subscription business models
— industries where US companies lead globally.
Showing this as a cycle signals that your business
thinks about customer relationships as ongoing
value delivery, not one-time transactions.
4-Step vs 5-Step vs 6-Step — Which Layout
Should You Use?
4-Step Cycle Diagrams
The clearest and most common format. Four equal
segments create a balanced, symmetrical layout that
reads immediately — no explanation needed. Best for
PDCA, simple product loops, and any process where
clarity is the priority. If you can consolidate your
process to four stages, do it — your audience will
thank you.
5-Step Cycle Diagrams
Adds nuance without overwhelming. Five stages
allow for more granular process representation
while still maintaining visual clarity. Common for
marketing cycles, customer success models, and
product development loops where a fifth stage —
typically “Optimize” or “Analyze” — adds
meaningful information.
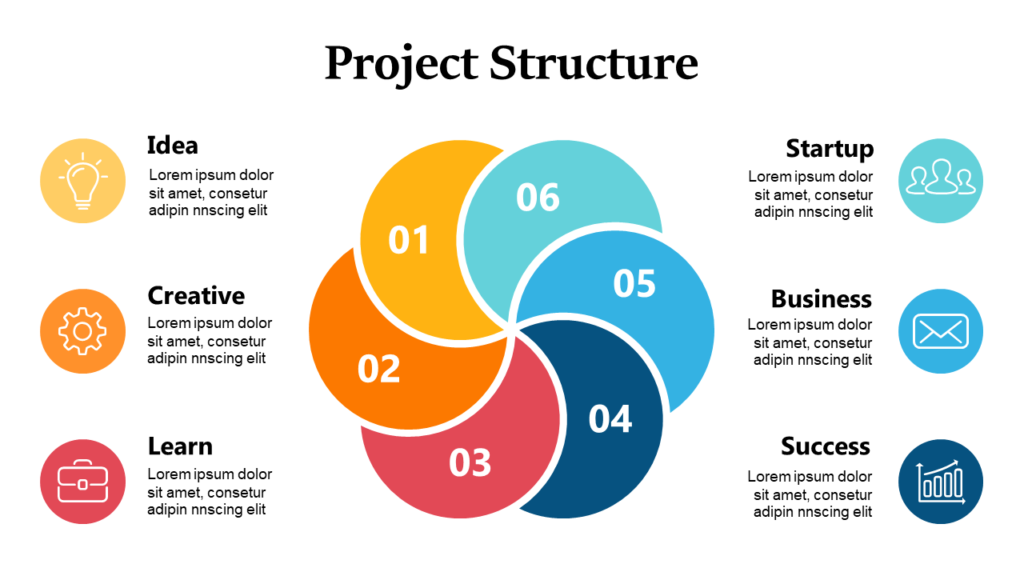
6-Step Cycle Diagrams
Reserve for processes where all six stages are
genuinely distinct and equally important. Six
segments can feel crowded — especially on a
projected slide in a conference room. If you’re
using a 6-step layout, make sure each stage label
is short (1-3 words) and the diagram has enough
white space to breathe. When in doubt, consolidate
two adjacent stages and use a 5-step instead.
Cycle Diagrams vs Circular Arrow Diagrams —
What’s the Difference?
They look similar but serve different purposes.
A cycle diagram shows stages of a repeating process
— each segment represents a distinct phase. A
circular arrow diagram shows direction of flow or
influence — the arrows are the message, not the
segments. Use cycle diagrams for process
communication. Use circular arrow diagrams for
showing relationships, ecosystems, or influence
patterns.
3 Common Mistakes with Cycle Diagram Slides
Too many stages
More than six stages on a single cycle diagram
creates visual noise. If your process genuinely has
eight stages, split it into two diagrams — a
high-level 4-stage overview and a detail diagram
for the complex section.
Unequal visual weight
When one segment is visually larger than others,
audiences assume that stage is more important —
even if you didn’t intend that. Keep all segments
equal unless you’re deliberately emphasizing one
phase. PowerPoint’s default shapes often create
uneven segments — pre-built templates solve this.
Wrong color logic
Using gradient colors around a cycle — light to
dark — implies directionality and hierarchy, which
contradicts the “all stages are equal” message of
most cycle diagrams. Use either a single color
throughout or alternating colors with equal
visual weight.
How to Build a Cycle Diagram in PowerPoint
(And Why Templates Are Faster)
Building a cycle diagram from scratch in
PowerPoint requires SmartArt or manual shape
construction. SmartArt cycle layouts are functional
but limited — you can’t easily customize colors,
gradients, or icon placement without breaking the
SmartArt structure. Manual construction gives full
control but takes 30-60 minutes per diagram.
Pre-built cycle diagram PowerPoint templates
give you professionally constructed layouts —
correct segment geometry, proper spacing, icon
placeholders, and editable text — in seconds.
For US business presentations where time is a
constraint and visual quality matters, starting
from a template is the practical choice.
Download Cycle Diagram PowerPoint Templates
SlideSwift’s Cycle Diagram templates include
4-step, 5-step, and 6-step layouts in Light and
Dark versions, 6 color variants, fully editable
PPTX format. One-time $9 — no subscription. Or
pick individual cycle diagram slides at $0.99
each from the Slide Library.