KPI Slide PowerPoint — 2 Dashboard Slides at $0.99 Each (2026)
You don’t need a full deck. You need one clean slide that shows your team’s numbers without making everyone squint at a table. These two KPI slides are $0.99 each — one built for tracking multiple metrics side by side, one for showing progress toward specific targets. Pick the one that fits what you’re presenting.
Tracking multiple metrics at once (revenue, completion rate, utilization) → Bar & Circular Charts slide ($0.99). Showing progress toward a specific target → Performance Gauges slide ($0.99). Both fully editable, instant download, PowerPoint + Google Slides.
Bar and Circular Charts — Best for Showing Multiple Metrics at Once
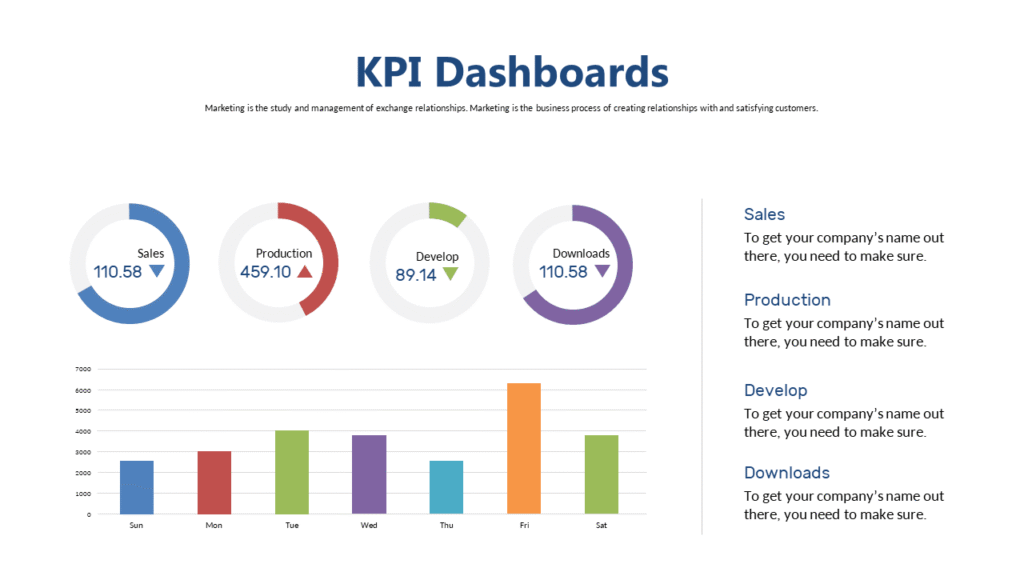
Weekly ops meeting. Four numbers on the table: on-time delivery, team capacity, project completion rate, revenue vs. target. You need all four visible on one slide — not as a table, not as bullet points, as a dashboard. Something a person sitting 10 feet away can read in 20 seconds. This slide combines bar charts and circular progress indicators in a single layout so you can show four to six metrics without crowding anything.
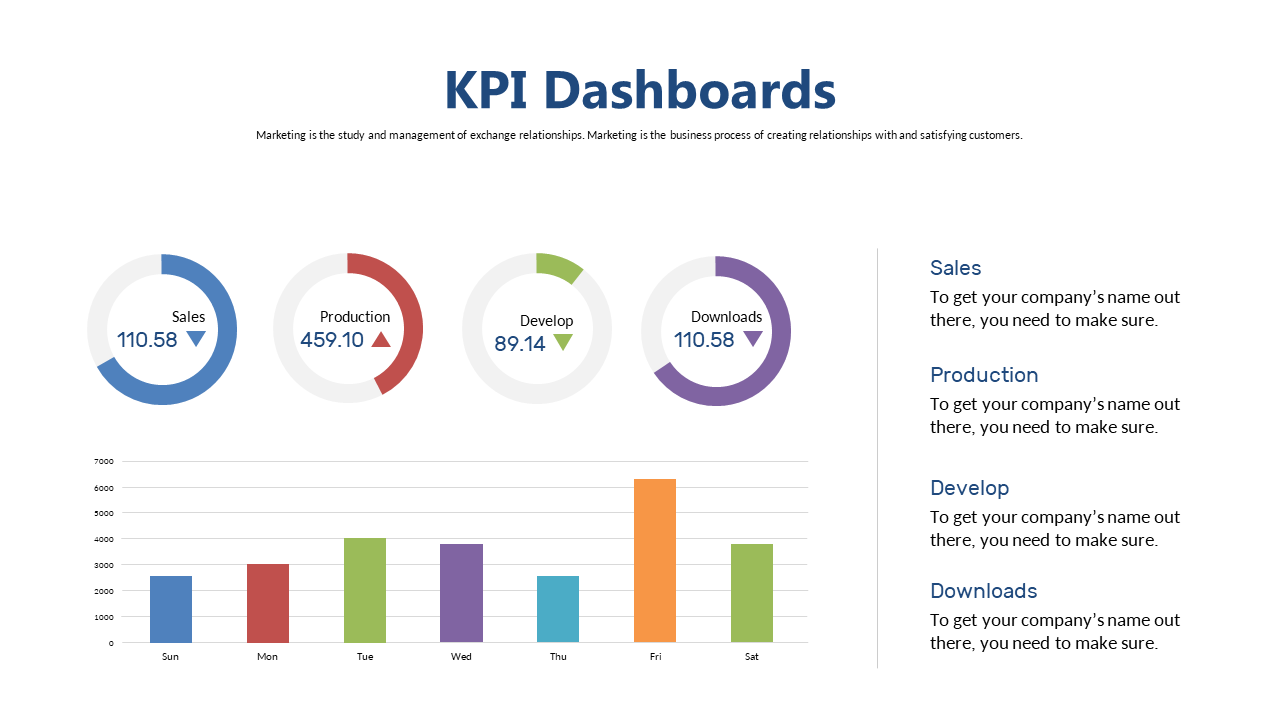
The layout divides into two visual zones: bar charts for comparisons over time on one side, circular percentage indicators on the other. It’s the format you’d see in an operations dashboard — except this is a single slide that drops directly into your existing presentation. Your ops lead can scan it once and know where things stand without a follow-up question.
📁 PowerPoint + Google Slides + Browser
✏️ Fully editable
Performance Gauges — Best for Showing Progress Against a Target
Different situation. You’re in a client review or executive summary and there’s one number that matters: are you at 68% of Q3 target or 91%? A gauge dial communicates that instantly. The needle position tells the story before the number registers. No one has to do mental math, no one has to look at a legend. This slide uses multiple gauge visuals — each representing a percentage against a goal — so you can show three or four targets on one slide without it reading like a report page.
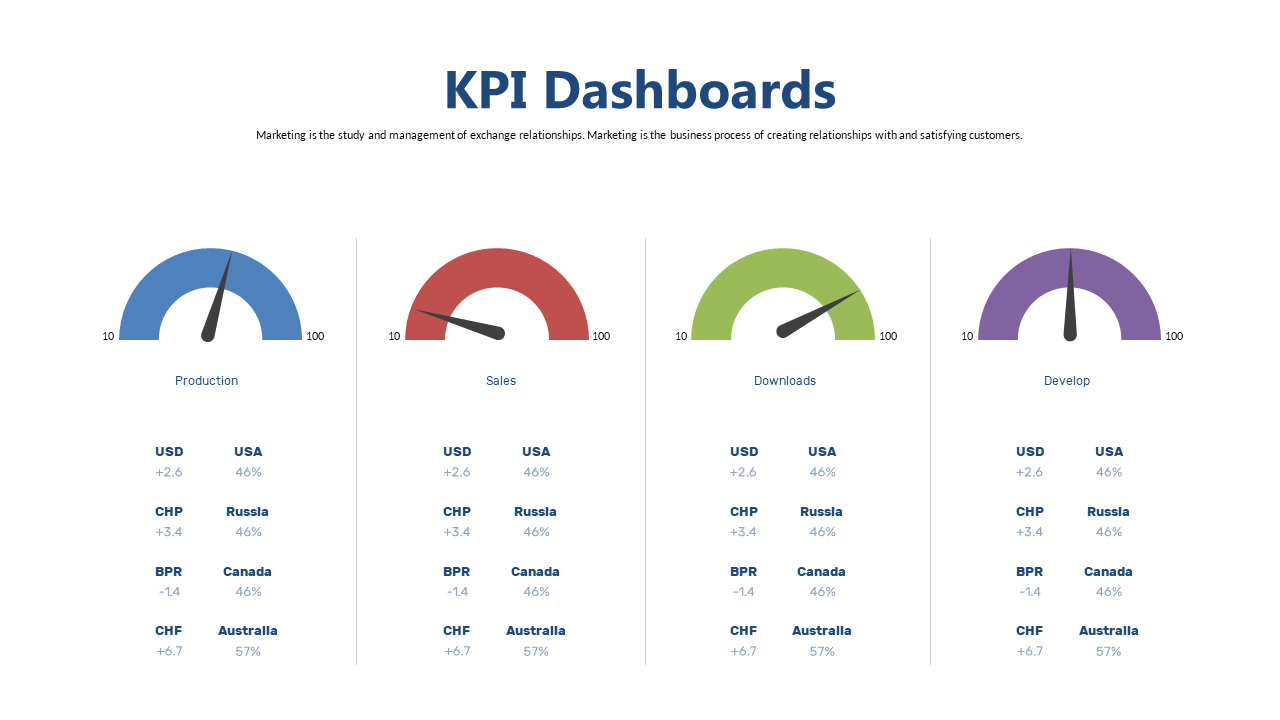
Gauge charts work particularly well in investor updates, sales reviews, and executive summaries where “how close are we to the goal” is the central question. The visual maps directly to how people read progress — intuitively, low to full. It’s more immediately readable than a bar chart when the question is percentage-to-target rather than trend over time. If your audience is assessing performance against a goal rather than tracking movement, this is the cleaner choice.
📁 PowerPoint + Google Slides + Browser
✏️ Fully editable
How to Drop This Slide Into Your Deck
The process takes 8 minutes the first time, less after that.
Step 1 — Open both files side by side. Download the slide and open it in PowerPoint or Google Slides. Open your main presentation in a separate window. You’re copying from one and pasting into the other — no manual rebuilding of the layout.
Step 2 — Copy and paste directly. In the slide file, select the slide in the left panel, copy it (Ctrl+C or Cmd+C), switch to your main deck, click between the two slides where you want it to appear, and paste. PowerPoint will ask whether to keep source formatting — say yes. The layout, fonts, and spacing all carry over intact.
Step 3 — Replace the data. Click into the charts on the pasted slide. For bar charts: right-click → Edit Data. For circular gauges: click the shape and adjust the percentage value in the Format panel. Update each metric to your actual number. That’s it — the slide looks identical to what you downloaded, with your data inside it.
Want a Complete KPI Deck Instead?
If you need more than one or two slides — a full quarterly review, a monthly ops report, or a board KPI summary — a complete deck template makes more sense than building slide by slide. Browse all KPI dashboard PowerPoint templates in the full template library, starting at $3.99 for 8 professionally designed slides.
Quick Questions
Which slide works better for a CFO audience?
The performance gauge slide reads faster at the executive level. A CFO scanning 20 slides in 10 minutes needs one thing per slide: on track, off track, by how much. The needle position on a gauge delivers that in under a second. Bar charts require a few more seconds to interpret — they’re better when you want to show trends over time. For a percentage-against-target question, go with the gauge.
Can I change the colors to match my company’s brand?
Yes. Every element on both slides is editable — shapes, chart fills, text. In PowerPoint, click any colored element and use the Format Shape panel to change the fill color. To update the entire slide at once, go to Design → Customize Colors and set your brand’s primary color as the accent. That changes charts, shapes, and highlights across the slide in one step.
Do these work in Google Slides?
Yes, both include a Google Slides version. Charts are editable — click into any chart and update the linked data table. Fonts may render slightly differently from the PowerPoint version depending on your browser, but the layout is identical. If you present directly from Google Slides, use that version — it’s built for it.
Pick your slide — $0.99 each