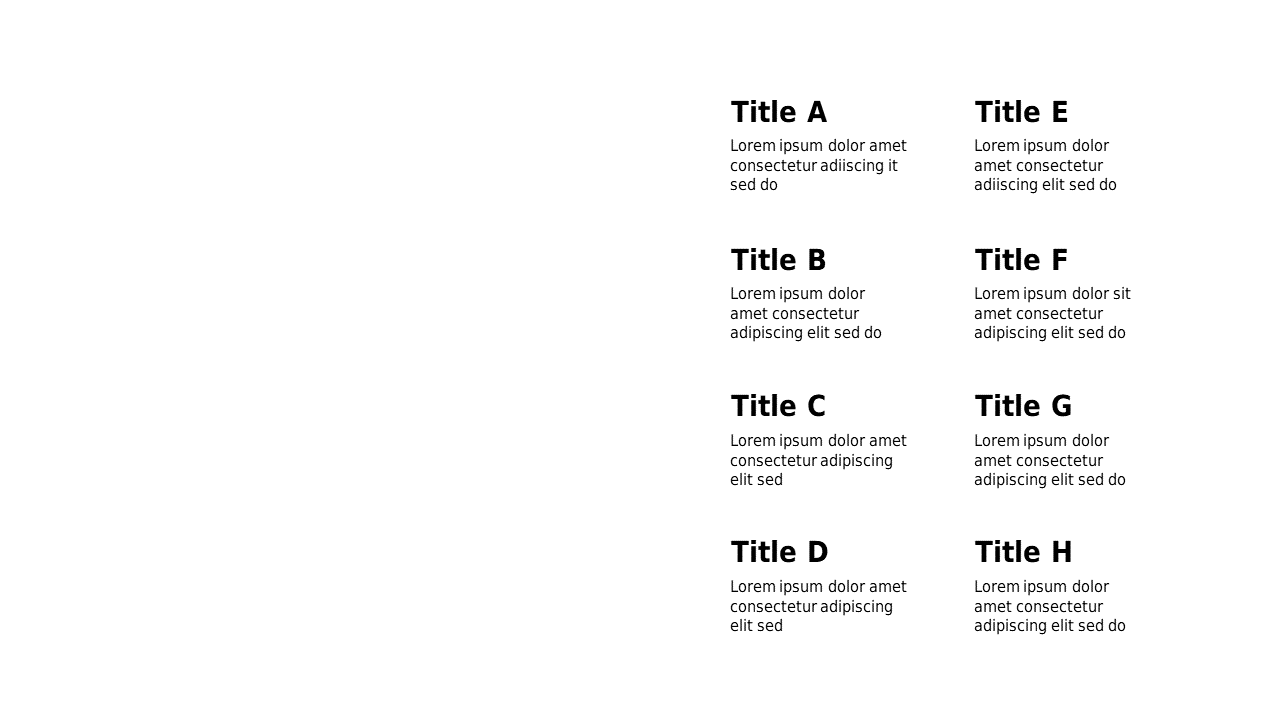
Present Summaries with 8-Section Content Grid
Product Description
Summarizing key points for a team or audience can be quite challenging, especially when you want to keep it concise and engaging. A cluttered design can distract from the core messages you need to deliver. This eight-section content grid allows you to present summaries in an organized and visually appealing way.
This slide is a great choice for educators summarizing lecture overviews, project managers recapping project phases, or team leads presenting performance metrics. It’s adaptable for various situations, whether you’re reporting to upper management or leading a training workshop, helping you convey information clearly and effectively.
At just $0.99, this slide is ready for immediate download. You can easily edit it in PowerPoint and Google Slides, allowing you to tailor the sections to fit your content in no time. Prepare your presentations like a pro with this valuable tool.
$0.99 – Purchase Checkout
Added to cart