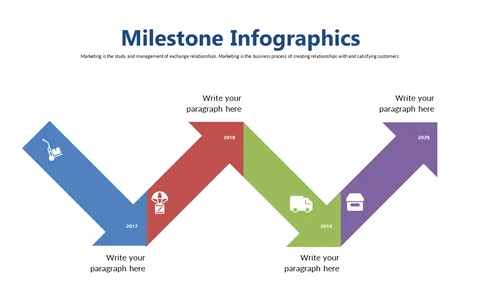
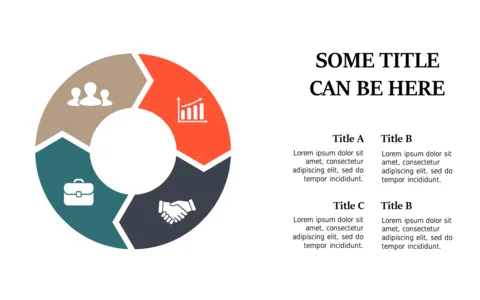
Visualize Progress with Colored Arrows and Milestones

Product Description
In project management, it’s easy for progress to get lost in the weeds. You need a clear way to showcase your milestones so everyone can quickly understand where the project stands.
This slide with colored arrows provides a visual representation that cuts through the clutter, allowing your audience to see timelines and developments at a glance. Project managers running status updates, team leads in weekly meetings, or even executives reviewing quarterly progress will find this slide indispensable. It’s perfect for conveying complex timelines during presentations, ensuring that everyone is on the same page about achievements and next steps.
For just $0.99, you can download this slide instantly and edit it easily in PowerPoint or Google Slides. It’s designed for quick customization, so you can have the perfect visuals ready in no time.
$0.99 – Purchase Checkout
Added to cart