Visualize Success Phases with Infographic Design

Product Description
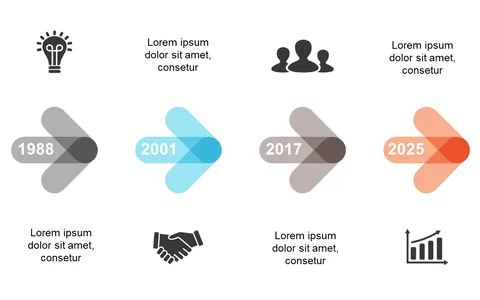
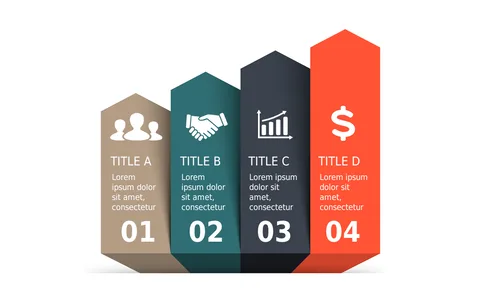
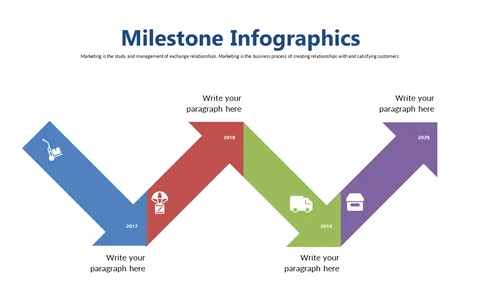
In a fast-paced world, effectively visualizing project phases is crucial for keeping your audience aligned and informed. You want to present your milestones in a way that captures attention and drives understanding.
This infographic design is perfect for project coordinators outlining progress, business leaders presenting strategic goals, or marketers sharing campaign milestones with teams. Its clean, engaging style is ideal for any setting where you need to communicate key phases without overwhelming your audience.
For just $0.99, you can download this slide, which is fully editable in PowerPoint and Google Slides. Customize the milestones with your project details and have it ready to go in no time.
$0.99 – Purchase Checkout
Added to cart