Showcase Phases of Success with Infographic

Product Description
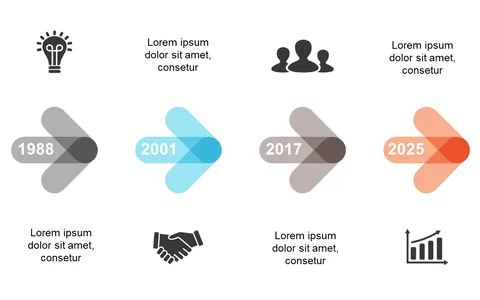
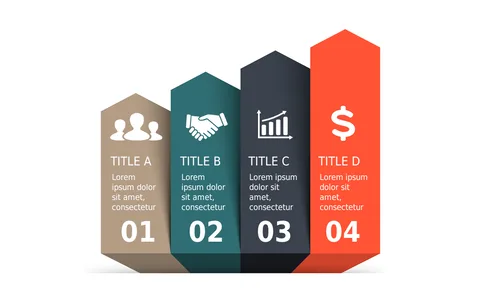
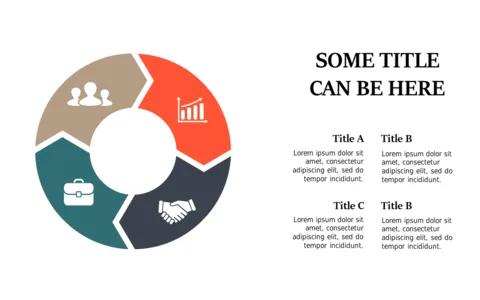
Communicating the phases of success can sometimes feel overwhelming, especially when you have multiple milestones to cover. You want your audience to follow your journey without losing focus on the key points.
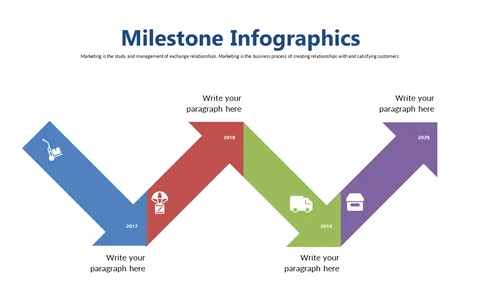
This infographic layout is ideal for business consultants summarizing project stages, product teams showcasing product development, or educational leaders presenting growth metrics in strategic meetings. It’s designed to help you illustrate complex ideas in a straightforward manner, making it perfect for any presentation where clarity is key.
Download this engaging slide for only $0.99 and edit it easily in PowerPoint or Google Slides. Customize the text and visuals to match your project specifics, and you’ll be ready to impress your audience in minutes.
$0.99 – Purchase Checkout
Added to cart