Visualize Social Media Resources with Percentage Data
Product Description
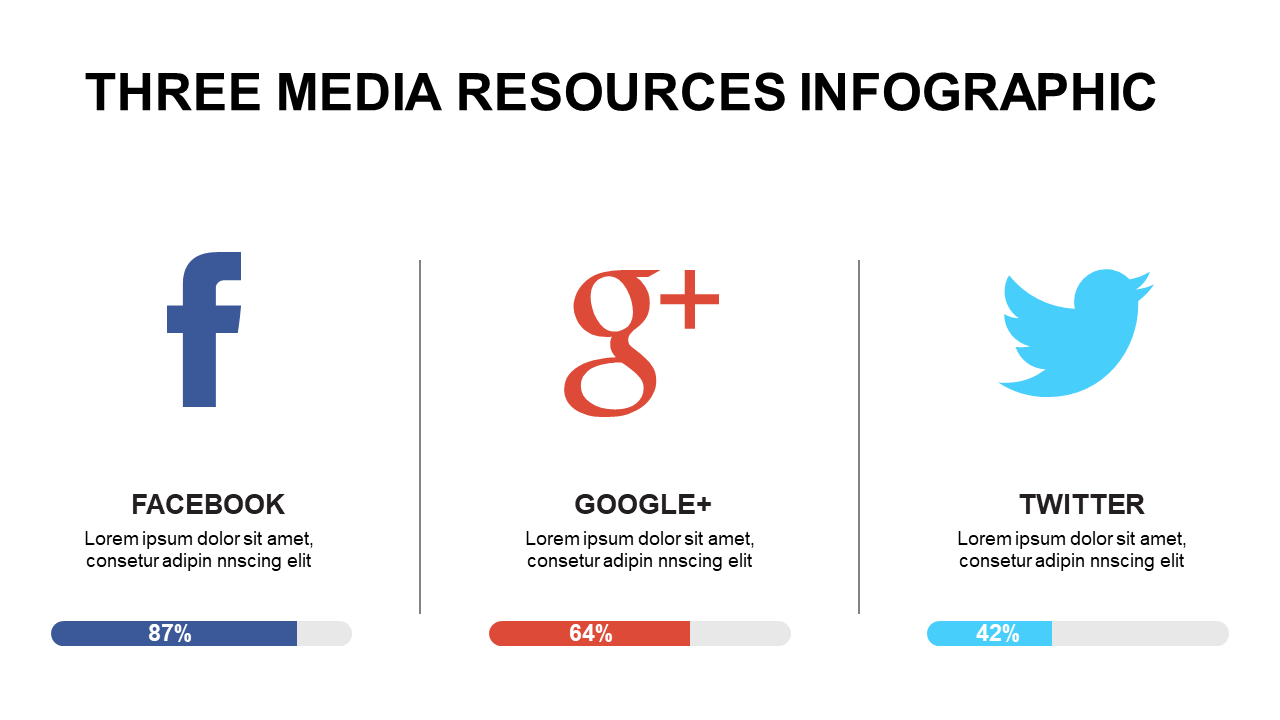
Turning complex social media statistics into something that’s easy to digest can be a real challenge. You need a way to present data that’s not only clear but also visually engaging to keep your audience’s attention. This infographic slide helps you convey essential information effectively without clutter.
Marketing managers who need to present resource allocation or performance metrics will find this slide highly useful during quarterly reviews or strategy planning sessions. It’s an excellent fit for anyone in the marketing field looking to make data-driven decisions based on social media performance.
Your insights deserve to be seen clearly. At just $0.99, this slide is ready for instant download and easy to customize in both PowerPoint and Google Slides. You’ll have a visually appealing presentation in no time, ensuring your statistics shine.
$0.99 – Purchase Checkout
Added to cart







