Present Information with Numbered Neumorphic Infographic
Product Description
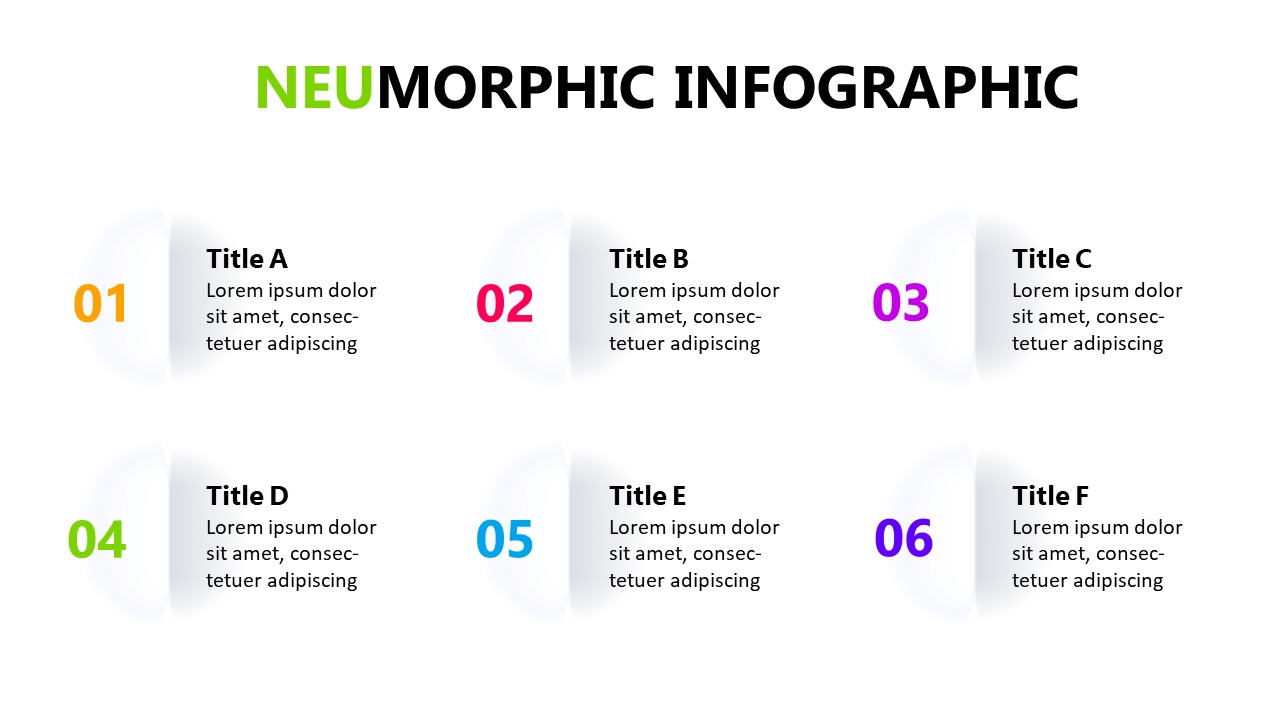
Grabbing attention while presenting data can feel like an uphill battle, especially with dense content. This unique neumorphic infographic slide features numbered sections that simplify complex information and encourage audience engagement.
It’s designed to make your points stand out clearly. Business analysts reviewing project data, educators teaching new concepts, and sales teams presenting product features can seamlessly incorporate this slide into their presentations. It’s perfect for team briefings, educational sessions, and client pitches where clarity is crucial.
For only $0.99, you can download this slide and start using it right away. It’s fully editable in both PowerPoint and Google Slides, so you can tailor it to suit your presentation style in just minutes.
$0.99 – Purchase Checkout
Added to cart







