Showcase Metrics with Neumorphic Infographic Design
Product Description
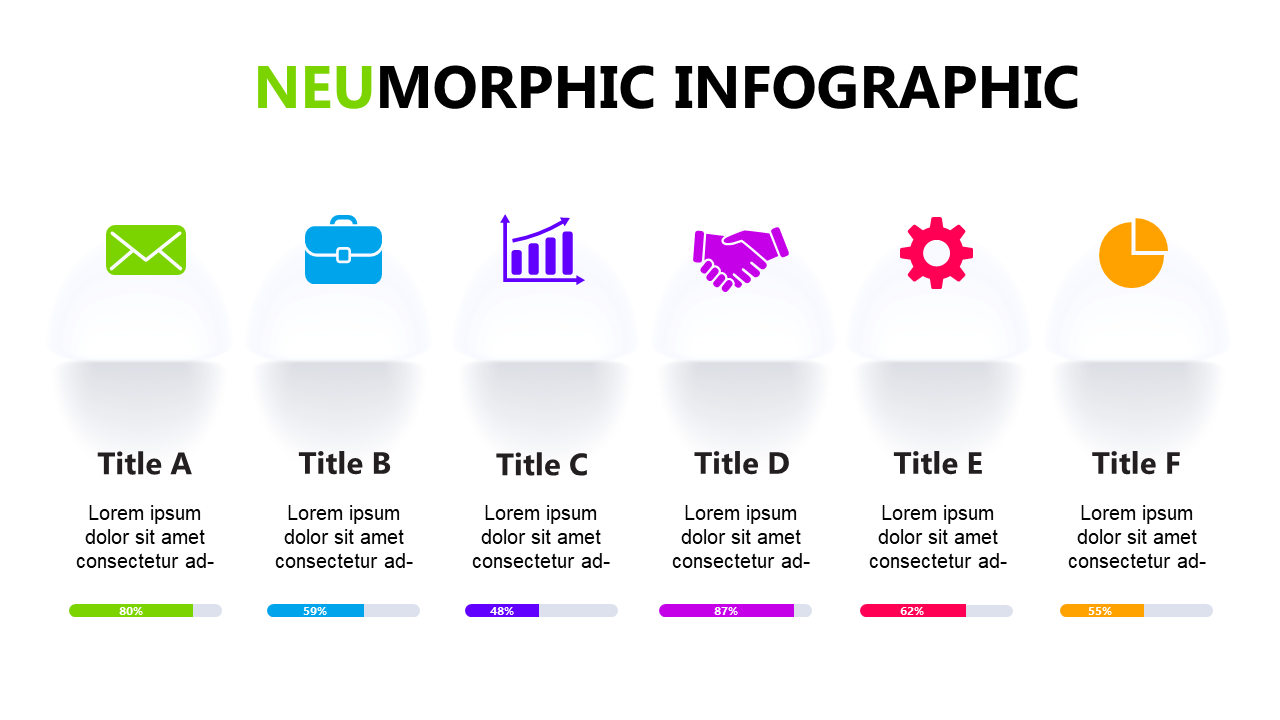
Communicating metrics clearly is often a struggle, particularly when data becomes overwhelming. This neumorphic infographic design creates a visually appealing way to present important figures, ensuring your audience grasps the key points without getting lost.
You’ll find it transforms dry data into compelling visuals. Finance analysts reporting quarterly earnings, project managers illustrating milestones, and sales professionals showcasing performance metrics can all benefit from this slide. It’s ideal for quarterly reviews, project updates, or any meeting where numerical data takes center stage.
Available for just $0.99, this slide is an instant download that can be edited in PowerPoint or Google Slides. You’ll have a professional-looking graphic ready to enhance your presentation in mere minutes.
$0.99 – Purchase Checkout
Added to cart







