Showcase Concepts with Split Circle Infographic
Product Description
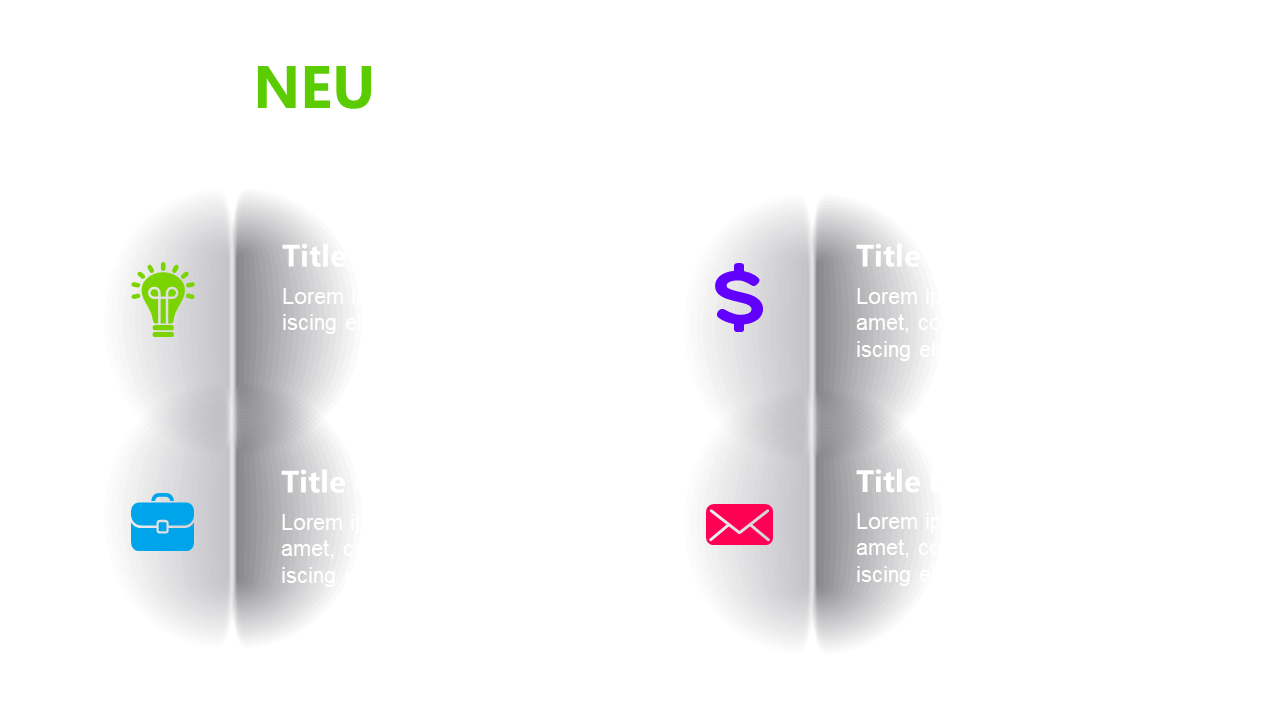
When you need to present multiple concepts, keeping things clear and engaging is crucial for audience comprehension. This split circle infographic slide simplifies complex information by allowing you to visually represent various ideas with accompanying icons.
It’s a perfect solution for breaking down intricate topics into digestible segments. Marketing strategists outlining campaigns, education professionals presenting curriculum frameworks, or entrepreneurs pitching innovative ideas can all utilize this engaging slide. It’s ideal for workshops, brainstorming sessions, or client presentations where clarity is paramount and ideas need to be communicated effectively.
Available for only $0.99, this slide can be instantly downloaded and easily edited in PowerPoint or Google Slides. Customizing it to fit your needs is straightforward, so you can create a professional presentation in no time.
$0.99 – Purchase Checkout
Added to cart







