Puzzle Piggy Bank for Financial Data
Product Description
Complex financial data can often leave your audience feeling lost, making it difficult for them to grasp your key messages. You need a way to simplify and visually present this information effectively.
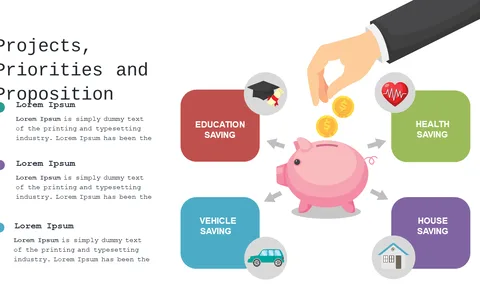
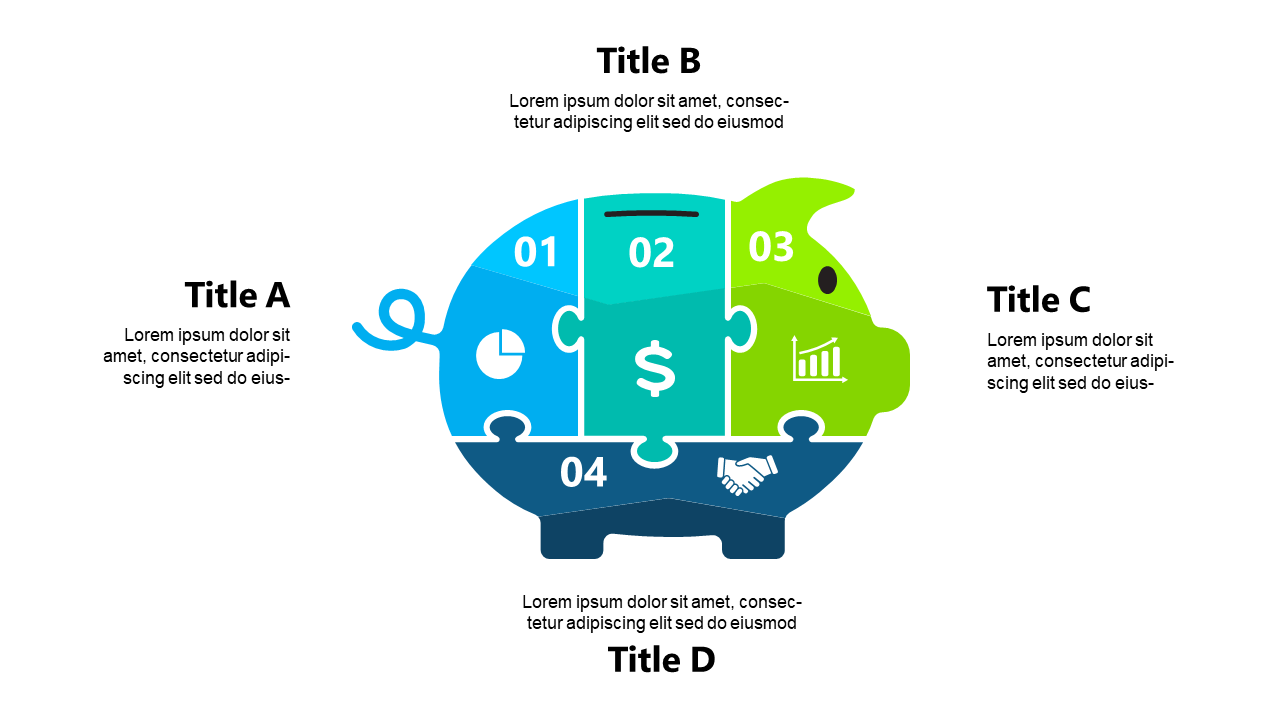
The puzzle piggy bank slide breaks down financial metrics into distinct parts, allowing you to highlight each aspect clearly and ensure your audience retains what’s important. This slide works well for finance professionals, budget analysts, or team leads during budget presentations, review meetings, or financial planning sessions. It’s especially useful when you need to present multiple metrics in an easily digestible format, enhancing audience engagement and understanding.
Download this eye-catching slide for just $0.99, and you’ll receive an editable format compatible with both PowerPoint and Google Slides. You can adjust the design to fit your data and presentation style with ease.
$0.99 – Purchase Checkout
Added to cart