Illustrate Timelines with Hourglass Design
Product Description
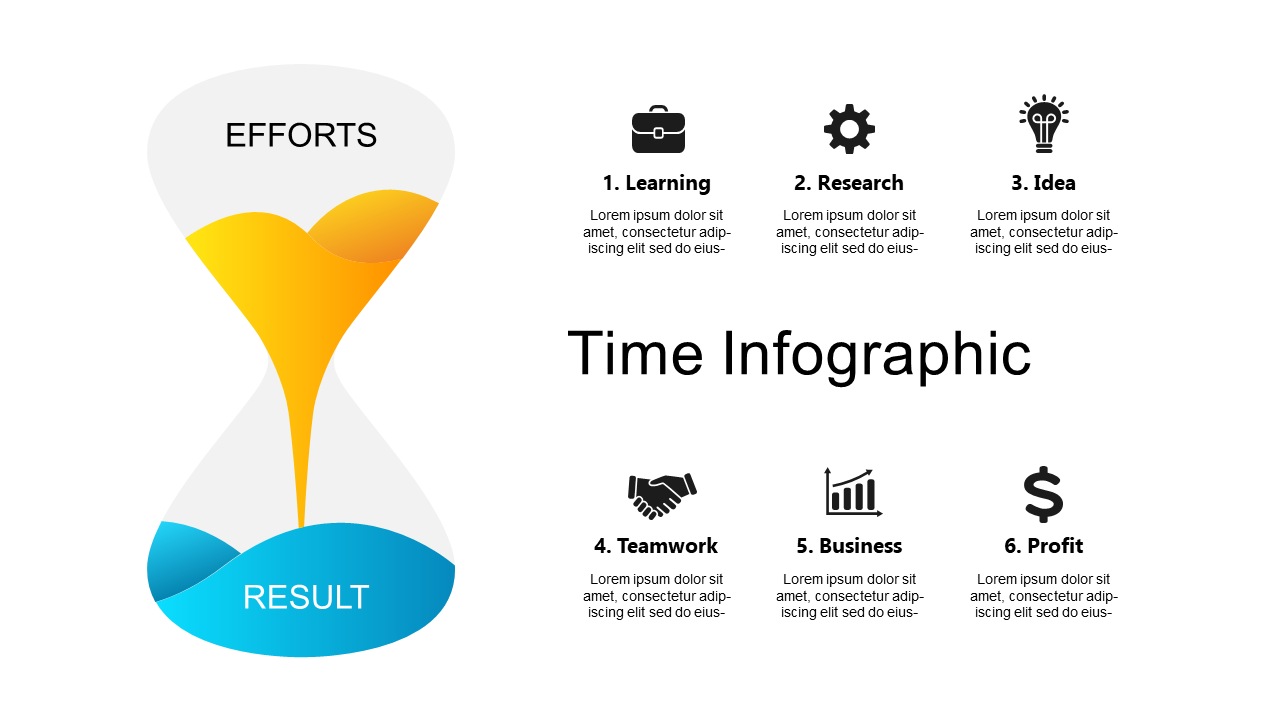
Finding the right way to illustrate project timelines can often be a struggle, especially when trying to convey the progression of efforts clearly. The hourglass design not only makes the timeline visually appealing but also emphasizes the relationship between time and results, ensuring your audience stays engaged.
Project managers can use this slide during progress meetings to showcase milestones, while marketers may find it helpful for campaign timelines. Whether you’re discussing the development of a new product or mapping out a marketing strategy, this layout serves as an excellent visual aid to highlight key actions over time.
At just $0.99, this slide is ready for instant download and can be easily edited in PowerPoint or Google Slides. Customize the text, colors, and icons to match your branding in just a few minutes.
$0.99 – Purchase Checkout
Added to cart







