Convey Concepts with Hourglass Infographic
Product Description
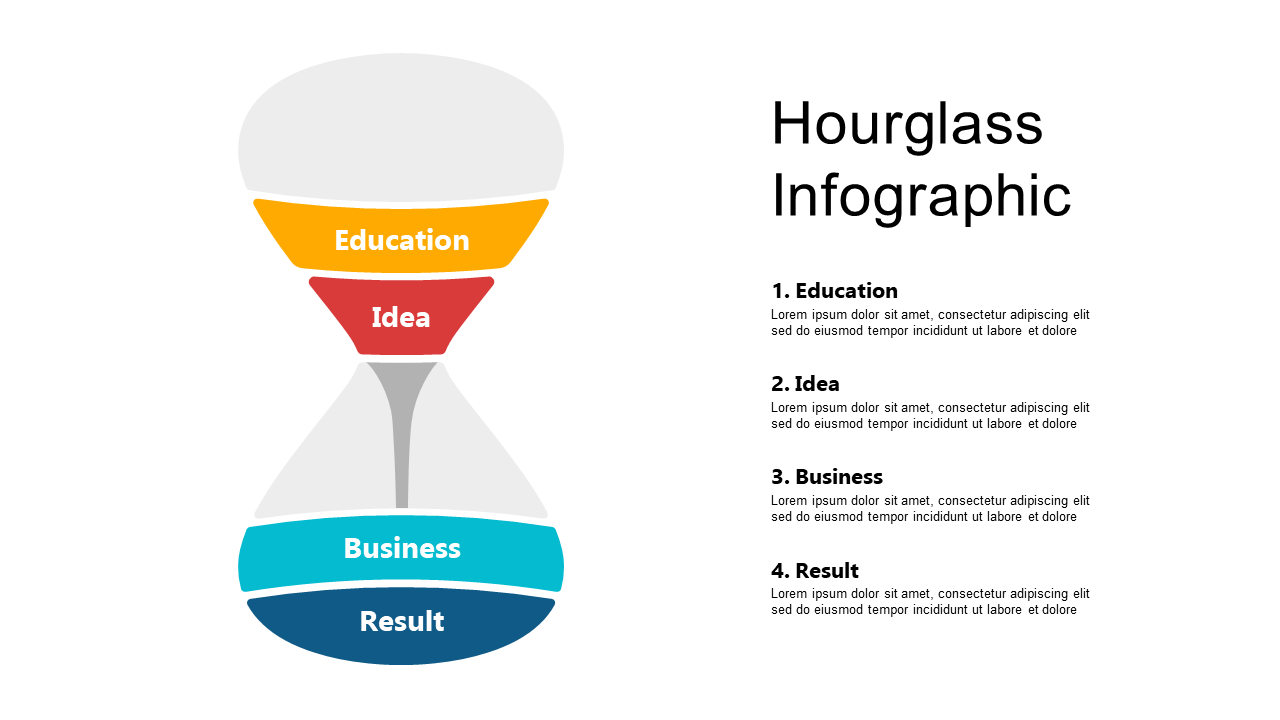
Simplifying complex concepts is crucial when you’re looking to engage your audience effectively. The hourglass infographic presents information across four distinct categories, making it easier for you to showcase ideas in education, business, and beyond.
It provides a clean, structured format that catches the eye and communicates your message clearly. This slide works wonderfully for educators discussing curriculum outcomes, business professionals summarizing project phases, or marketers outlining the steps from idea to result. Its versatility makes it an excellent choice for a variety of presentation needs.
Available for just $0.99, this slide is an instant download and can be easily edited in both PowerPoint and Google Slides. You’ll be able to customize it quickly, so you’re ready to wow your audience in no time.
$0.99 – Purchase Checkout
Added to cart







