Visualize Research Steps with Science Infographic
Product Description
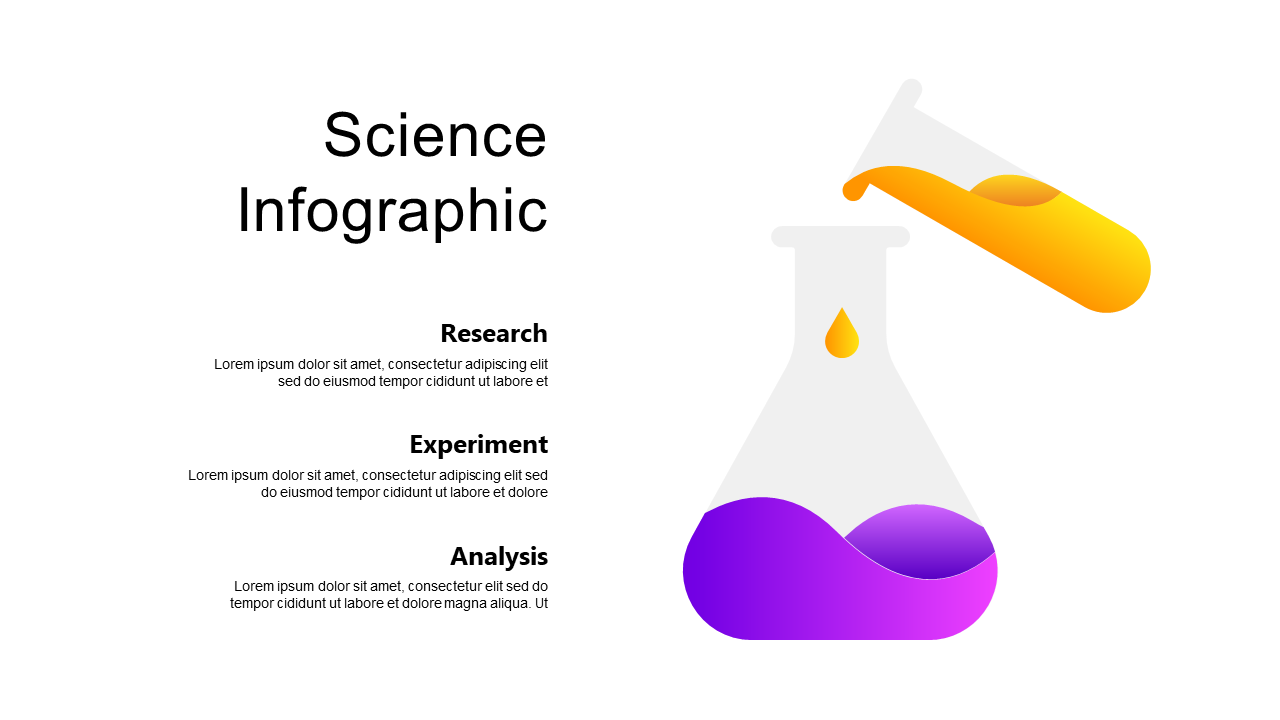
Complex information can overwhelm your audience, especially when it comes to research processes. This infographic layout featuring colorful laboratory beakers simplifies the presentation of research steps, making it easier for your colleagues to follow along.
It’s structured to guide your audience through the intricacies of research in a visually appealing way. Science educators, researchers, and academic presenters will find this slide particularly helpful during lectures, research presentations, or grant proposals. It allows you to clearly outline each phase of the research process, ensuring that your audience understands your methodology and findings.
For only $0.99, this slide is available for immediate download and is fully customizable. You can easily edit it in PowerPoint or Google Slides, making it simple to personalize the content to fit your unique presentation needs.
$0.99 – Purchase Checkout
Added to cart







