Engage with Scientific Research Infographic
Product Description
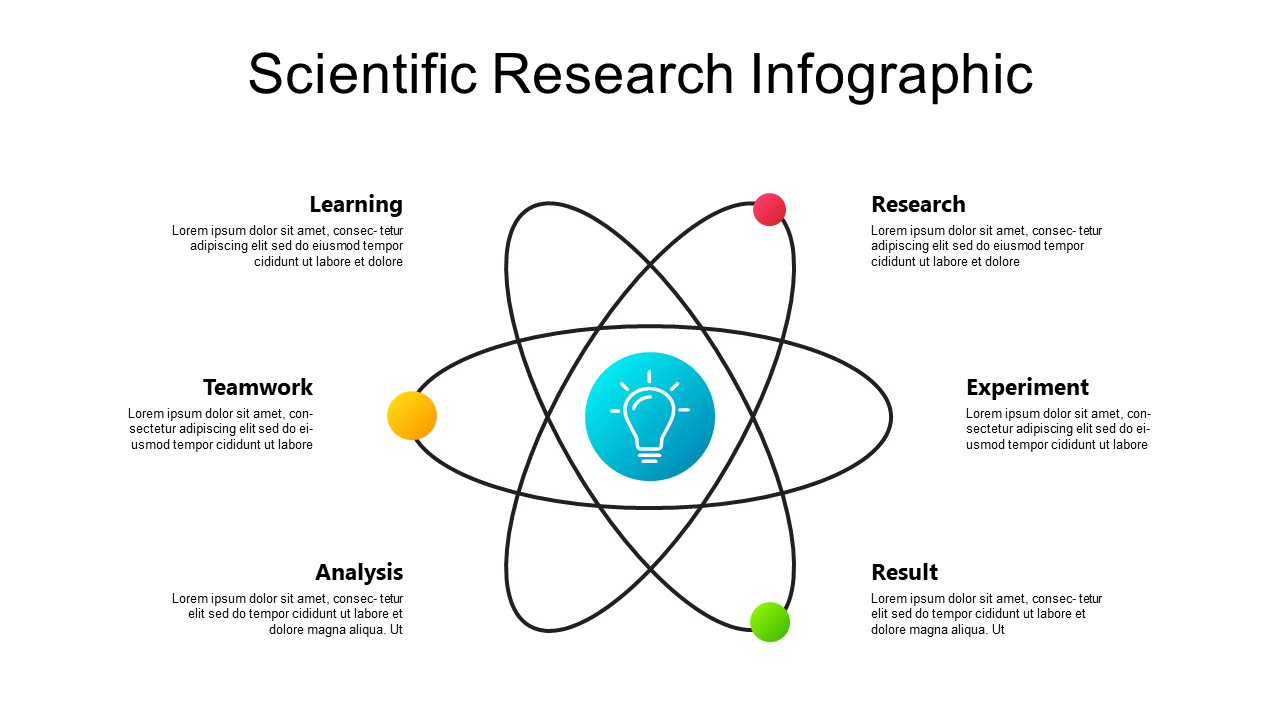
Simplifying complex information is a common challenge in scientific presentations, and visuals can make a significant difference in clarity. This infographic slide, centered around a lightbulb, helps convey core ideas in scientific research by connecting various concepts visually.
It’s designed to keep your audience engaged and make your message memorable. Educators, researchers, and science communicators can benefit from this slide during lectures, conferences, or workshops aimed at science literacy. Whether you’re discussing experimental findings, research methodologies, or educational initiatives, this slide provides a compelling visual aid to enhance your presentation.
You can download this slide for just $0.99, and it’s ready for immediate use. Editing is a breeze in PowerPoint or Google Slides, so you can quickly adapt it to your specific content and style within minutes.
$0.99 – Purchase Checkout
Added to cart







