Illustrate Timelines with Circular 12-Hour Infographic
Product Description
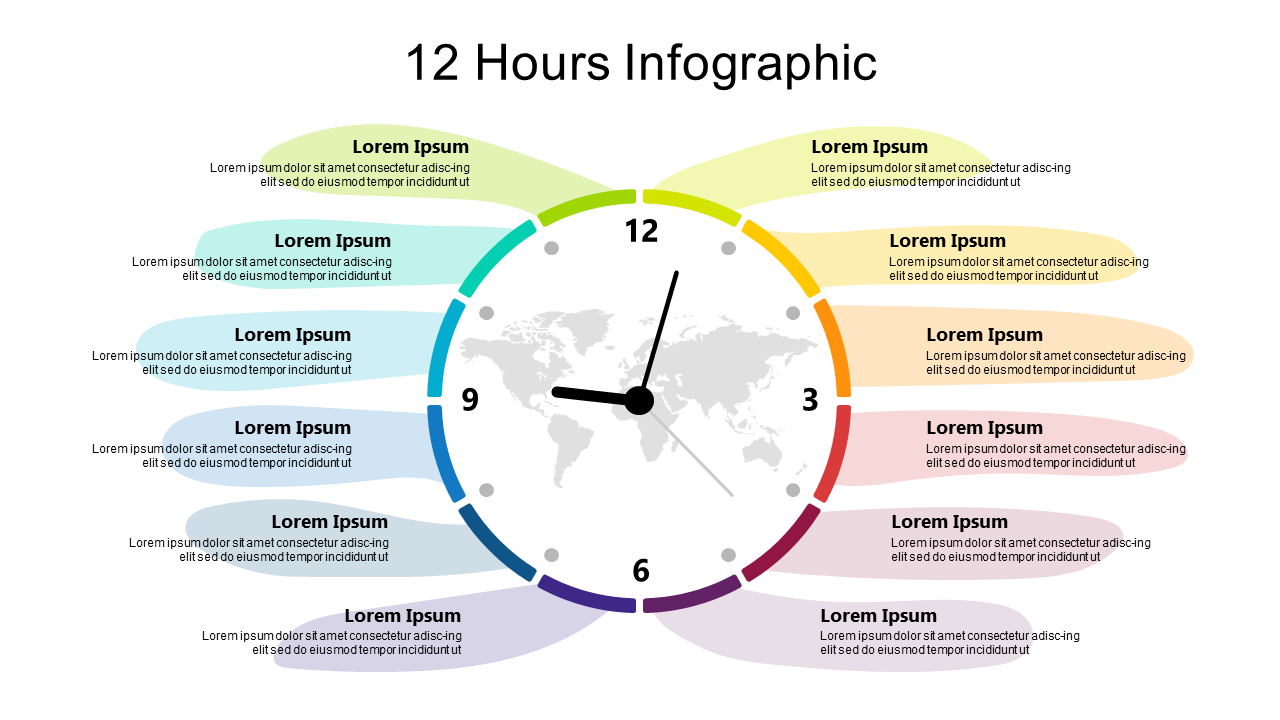
When you’re trying to present time-sensitive information, it can be tough to keep your audience engaged and focused. A visual representation like this circular 12-hour infographic allows you to display timelines effectively, making complex schedules easier for your team to grasp. The world map backdrop adds an appealing touch that helps contextualize your data.
Project managers working on global initiatives or operations directors planning international meetings will find this slide particularly useful. It’s perfect for showcasing project timelines, event schedules, or even global collaboration efforts during strategy sessions.
The design is engaging and can facilitate clearer communication among your colleagues. For just $0.99, you can download this slide instantly and start customizing it to fit your needs. It’s easy to edit in both PowerPoint and Google Slides, allowing you to tweak colors, text, and layouts in just minutes.
$0.99 – Purchase Checkout
Added to cart







