Organize Ideas with Quadrant Infographic
Product Description
When you have a flurry of ideas bouncing around, making sense of them can feel overwhelming. You need a clear way to organize and communicate your thoughts so that your audience can easily grasp the relationships between different concepts.
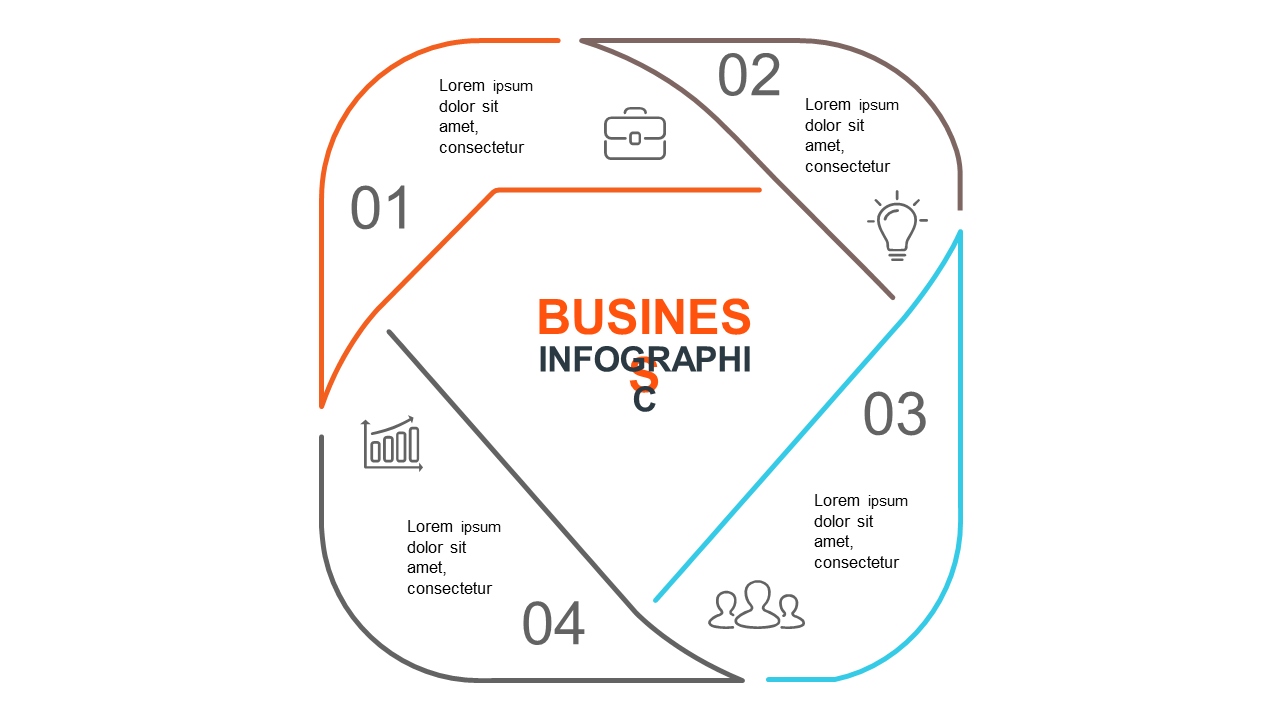
This quadrant infographic helps you do just that, providing a structured visual that makes comparing ideas straightforward. This slide is perfect for marketers crafting campaigns, educators designing lesson plans, or consultants sharing strategic insights. Whether you’re presenting at a team meeting, leading a workshop, or preparing for a client pitch, this layout helps you bring clarity to complex information, making it accessible and engaging.
At just $0.99, this slide is an instant download and can be fully edited in PowerPoint and Google Slides. You can easily adjust the text, colors, and icons to suit your specific needs, ensuring your presentation stands out in just minutes.
$0.99 – Purchase Checkout
Added to cart







