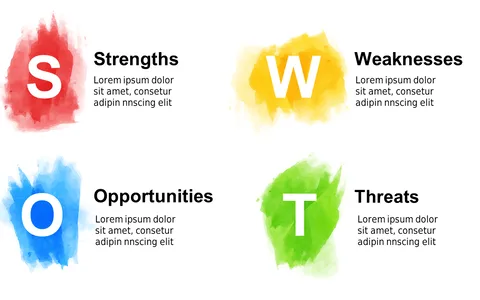
Engage Stakeholders with SWOT Puzzle Diagram

Product Description
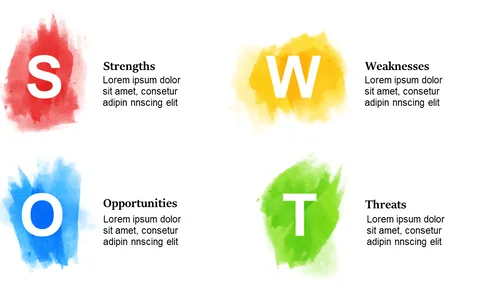
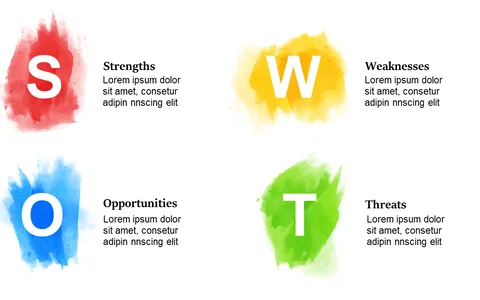
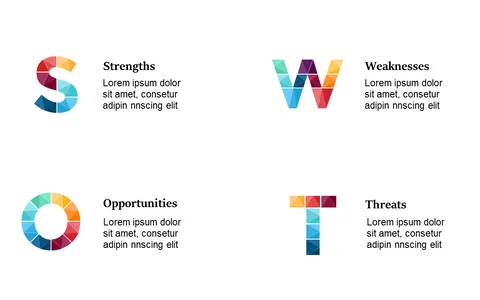
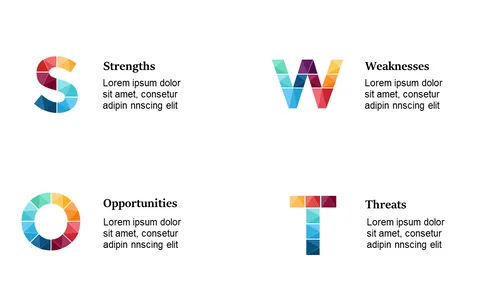
When it comes to explaining SWOT analysis, it’s easy to lose your audience in complex details. This dynamic puzzle diagram provides a clear visual representation of the strengths, weaknesses, opportunities, and threats, directly addressing the challenge of making complex information accessible and engaging.
This slide is a perfect fit for product managers launching new initiatives or sales leaders analyzing market trends. Use it during strategy workshops, team meetings, or client presentations to convey critical insights in a concise and visually appealing manner.
For just $0.99, you can instantly download and customize this slide to fit your presentation style. It’s compatible with both PowerPoint and Google Slides, allowing you to adjust the content and colors to match your unique requirements with ease.
$0.99 – Purchase Checkout
Added to cart