Facilitate SWOT Analysis with Circular Diagram

Product Description
When preparing for a strategic planning session, ensuring your presentation resonates with your audience can be a real challenge. Many professionals struggle to lay out complex frameworks like SWOT in an accessible manner.
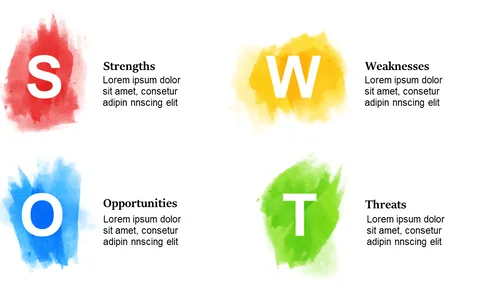
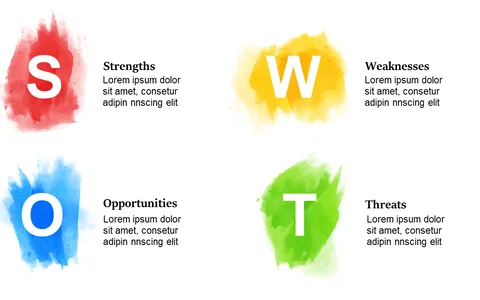
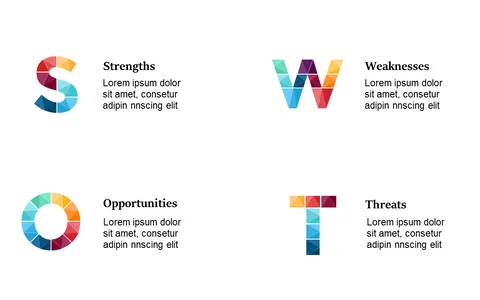
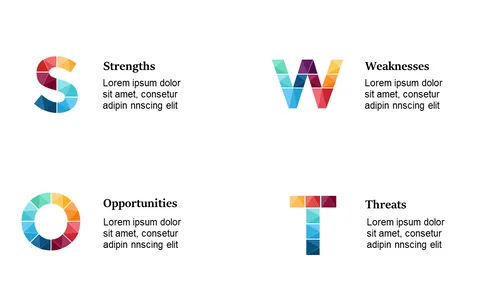
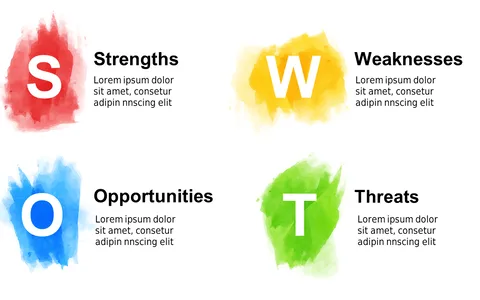
This circular diagram offers a visual organization of your strengths, weaknesses, opportunities, and threats, allowing for a clearer discussion. This slide is perfect for marketing managers, business strategists, and team leaders who need to present actionable insights during planning meetings or strategic reviews. It’s also a great fit for workshops focused on risk management or competitive analysis, where clarity can greatly influence decision-making.
At just $0.99, this slide is ready for instant download and quick customization in both PowerPoint and Google Slides. Edit it to fit the specific context of your analysis, and you’ll be set to engage your audience in no time.
$0.99 – Purchase Checkout
Added to cart