Battery Infographic for Process Representation
Product Description
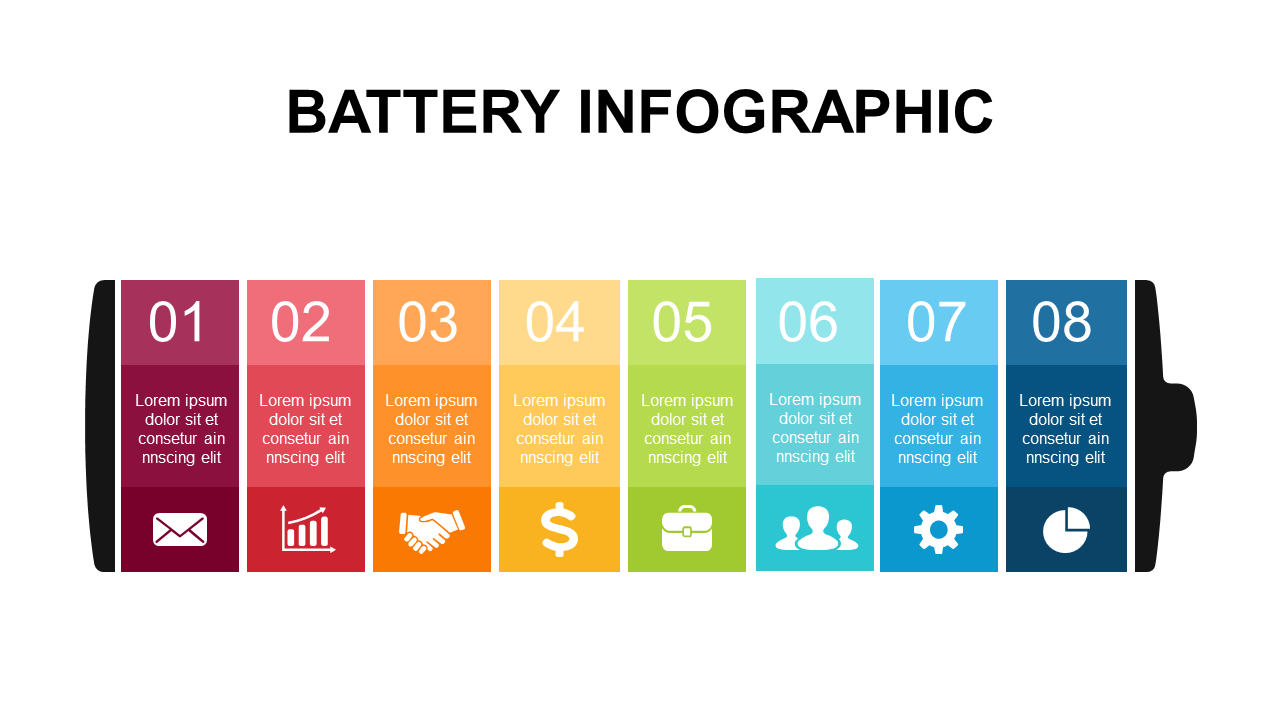
Presenting intricate processes can be daunting, especially when clarity is crucial for understanding. This vibrant battery infographic helps you break down workflows into manageable pieces, making it easier for your audience to grasp complex information.
Use this slide when working as a process engineer outlining steps in a production line, or in a training session as a corporate trainer explaining key phases of a new system. It’s also ideal for business analysts looking to present data flow in a project update meeting.
At just $0.99, you can download this engaging infographic and tailor it to your specific needs. It’s easy to modify in both PowerPoint and Google Slides, allowing you to make it your own in mere minutes.
$0.99 – Purchase Checkout
Added to cart







