Visualize Stages with Step-by-Step Chart Infographic
Product Description
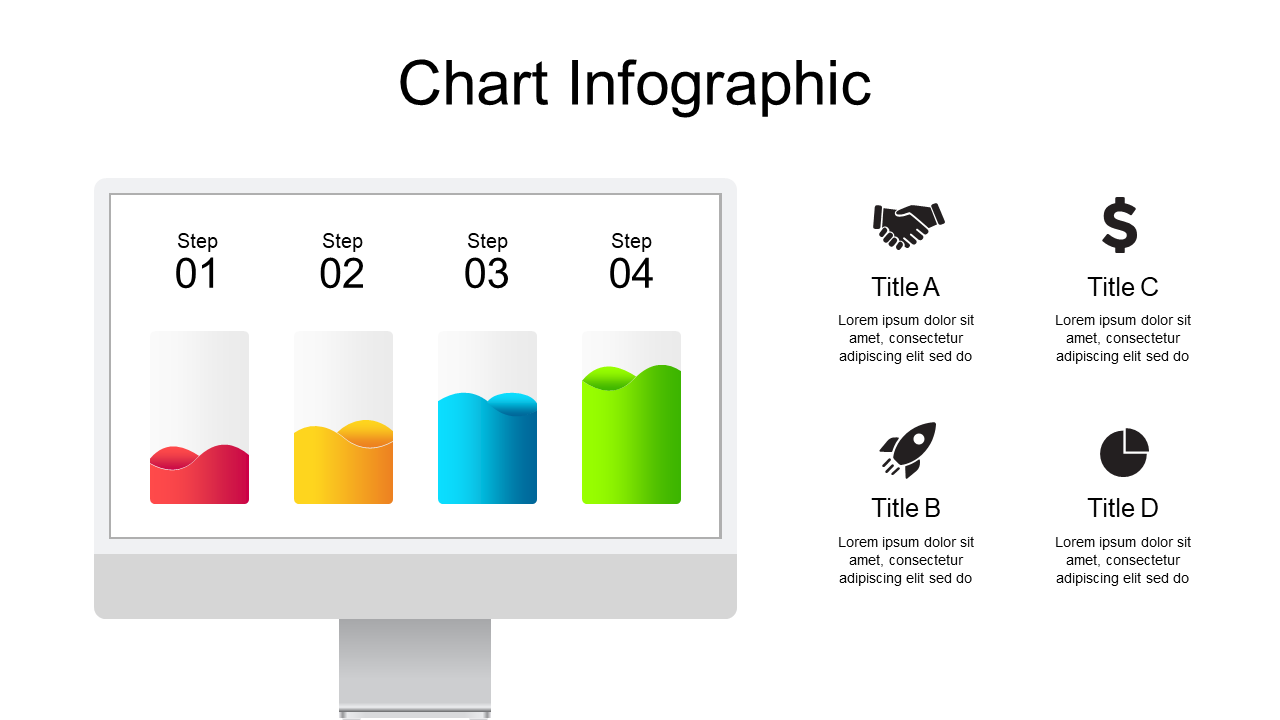
Communicating complex processes can be tricky, and without the right visuals, your audience might struggle to keep up. This step-by-step chart infographic provides a straightforward way to visualize stages, ensuring clarity and comprehension throughout your presentation.
This slide is ideal for business analysts presenting project milestones, educators illustrating learning outcomes, or marketing teams showing campaign timelines. The clear design of the infographic allows for easy customization, making it fit perfectly with your specific content needs.
Available for just $0.99, this slide can be downloaded instantly and customized to your liking. It’s fully editable in both PowerPoint and Google Slides, so you can get it ready to impress your audience in no time.
$0.99 – Purchase Checkout
Added to cart







