Curved Roadmap Infographic for Milestones

Product Description
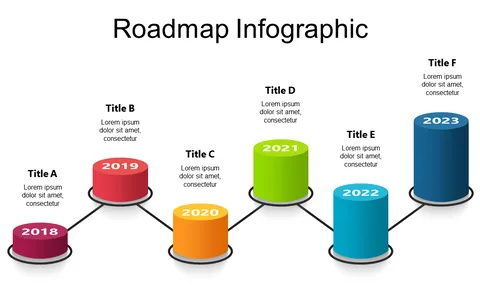
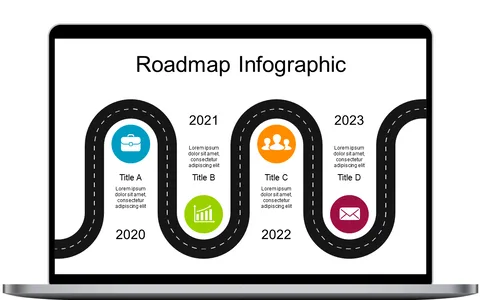
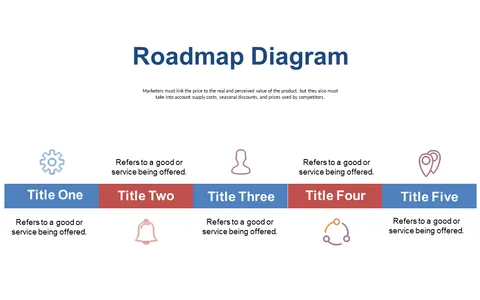
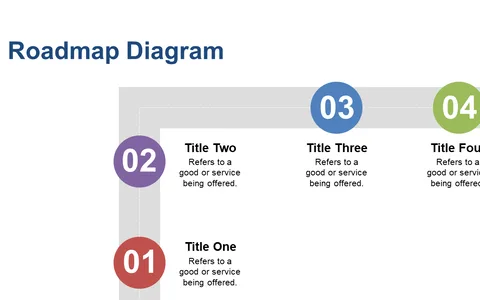
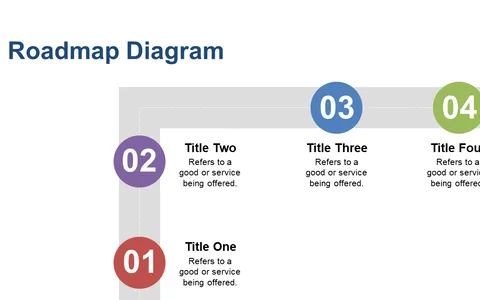
Describing important milestones can be a challenge, especially when aiming to keep your audience engaged. This curved roadmap infographic is crafted to highlight key points in your strategy while making the information visually appealing and easy to digest.
Whether you’re a project manager outlining deliverables or a business analyst presenting future goals in a quarterly review, this slide is perfect for anyone needing to chart a course over time. It’s especially useful in industries like construction or product development where milestones are crucial indicators of progress.
Grab this slide for just $0.99 and download it instantly for your presentation needs. You’ll find it easy to edit in both PowerPoint and Google Slides, allowing you to personalize each milestone with your own text and icons.
$0.99 – Purchase Checkout
Added to cart