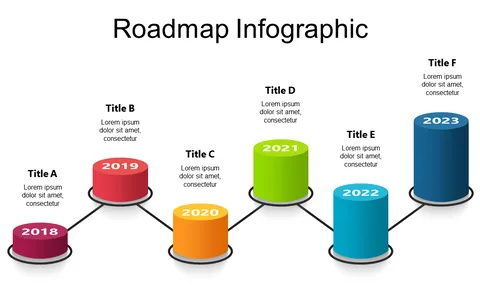
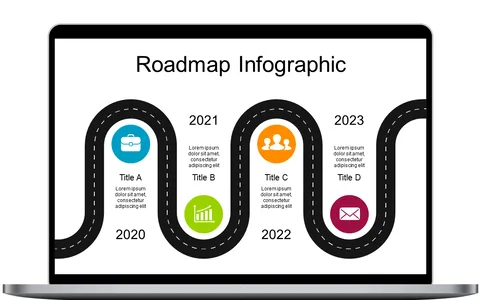
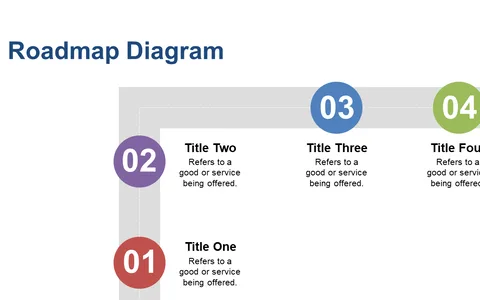
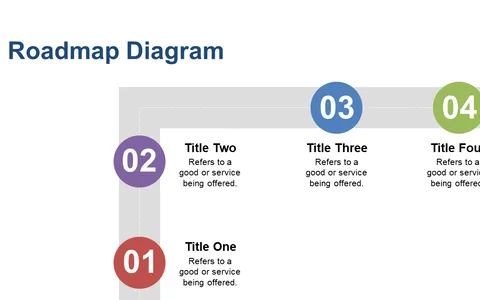
Curved Roadmap Infographic for Project Planning

Product Description
Presenting project timelines can often feel overwhelming, particularly when you need to convey intricate details to your audience. This curved roadmap infographic simplifies that process, offering a visually engaging way to showcase your strategic direction and key milestones without losing clarity.
Project managers and team leaders in sectors like tech and marketing will find this slide invaluable for meetings where you discuss project timelines and future objectives. Use it to illustrate your project’s phases during status updates or strategy sessions, ensuring everyone understands the path forward.
For just $0.99, you can instantly download this slide and start using it right away. It’s fully editable in PowerPoint and Google Slides, making customization a breeze so you can tailor it to fit your specific project needs.
$0.99 – Purchase Checkout
Added to cart