Engaging Left vs Right Brain Comparison Infographic
Product Description
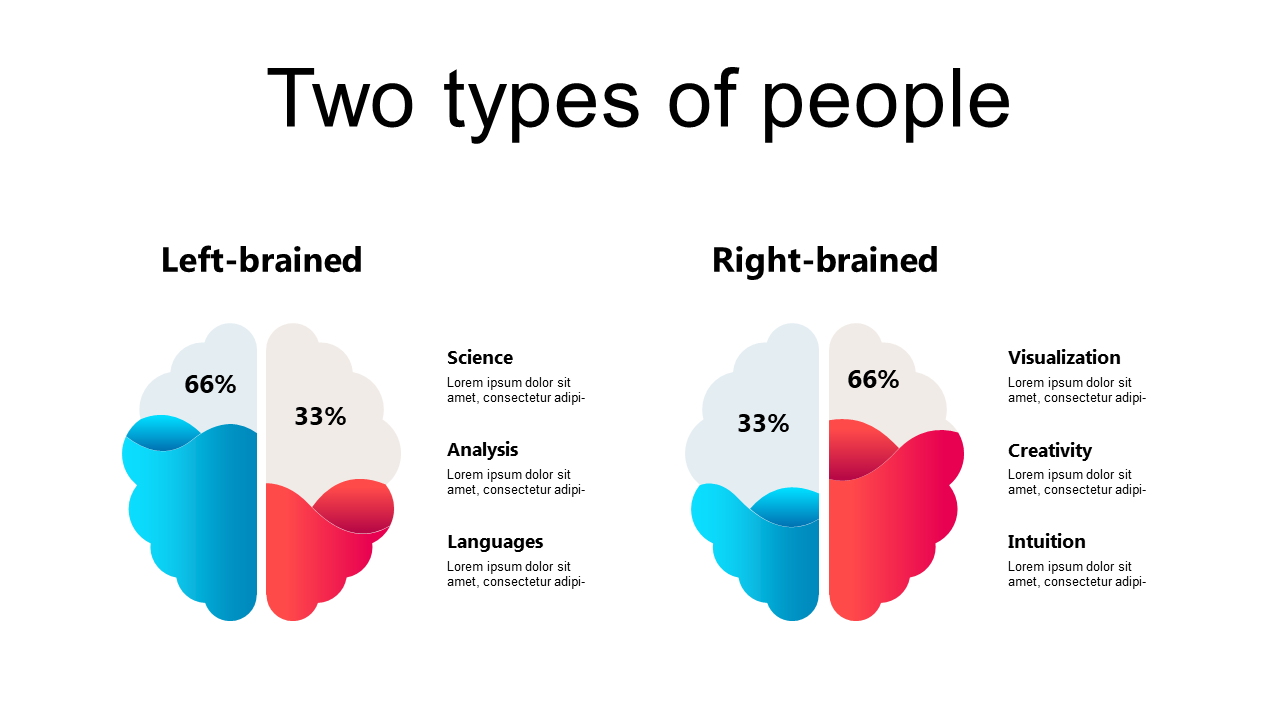
Explaining the nuances of personality traits can be challenging, especially when trying to highlight differences between left-brained and right-brained tendencies. This engaging infographic makes those distinctions clear and visually appealing, allowing your audience to grasp the content effortlessly. It serves as a bridge to understanding how diverse thinking styles impact behavior and decision-making.
Perfect for educators, corporate trainers, and psychologists, this slide is ideal for workshops focusing on personal development or team dynamics. Use it to facilitate discussions on how individuals think and approach problems differently, enhancing your audience’s understanding of themselves and others.
This infographic aids in creating a more collaborative and productive environment. At only $0.99, this slide is ready for immediate download and is easily editable in PowerPoint and Google Slides. You can personalize it with your own text and colors in minutes, aligning it with your presentation goals and making it both informative and visually striking.
$0.99 – Purchase Checkout
Added to cart







