Visual Comparison of COVID-19 Vaccines
Product Description
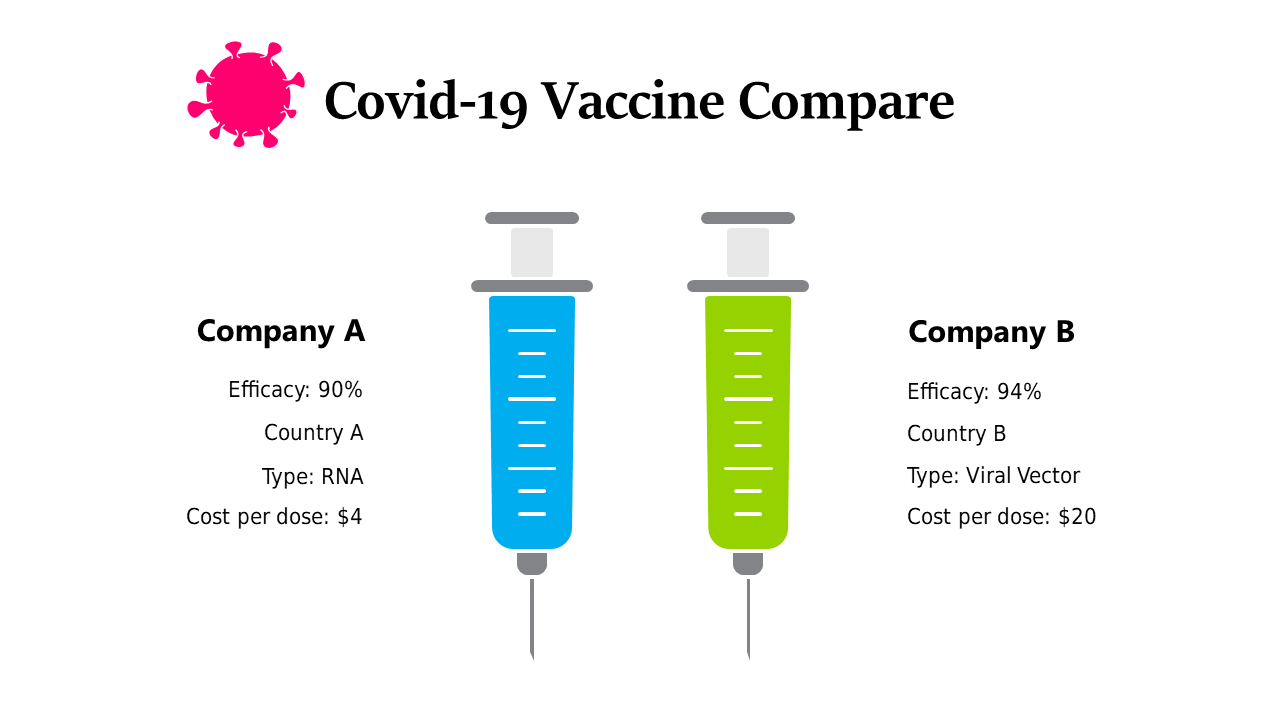
It’s tough to compare COVID-19 vaccines when you want to present clear, comparable data. With varying efficacy rates and costs, the challenge is making this information digestible for your audience, whether they’re healthcare workers or policymakers who need to make informed decisions. An effective visual can bridge that gap and aid understanding.
This slide works perfectly for healthcare professionals conducting educational sessions about vaccine options or for policymakers drafting reports that require clear visual aids. Educators can also use this in classrooms to help students grasp the importance of vaccine information without getting lost in the details.
At just $0.99, this infographic slide is available for instant download and is easily editable in both PowerPoint and Google Slides.
You can customize names, efficacy rates, and more in just minutes to fit your presentation needs.
$0.99 – Purchase Checkout
Added to cart







