Content Overview with Laptop Display

Product Description
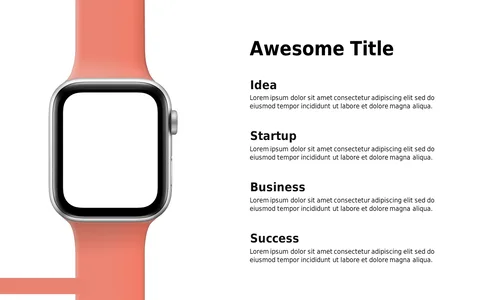
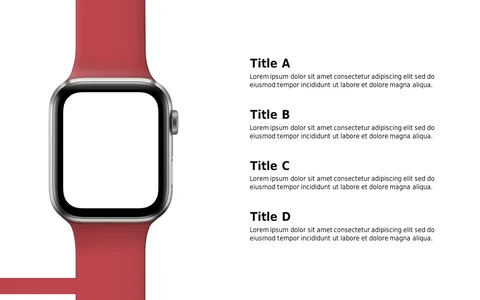
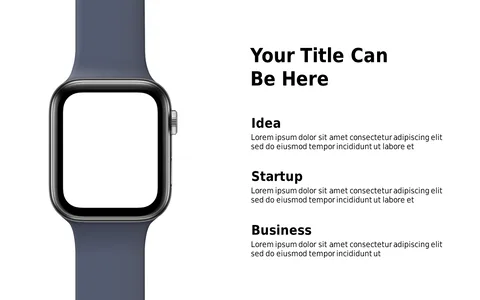
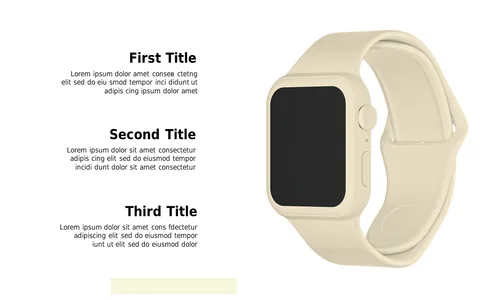
Presenting information alongside visuals can often help your audience better understand complex ideas. This slide’s laptop display, combined with a sidebar for additional text or graphics, creates the perfect balance of visuals and information.
It’s great for marketing teams showcasing product features, project managers updating stakeholders on progress, or tech professionals giving device demonstrations. This layout invites your audience to engage with both the technical content and the overarching narrative you are sharing.
You can get this slide for just $0.99, and it’s ready for download. Editing it in PowerPoint or Google Slides is a breeze, allowing you to make quick changes and customize it to suit your presentation style.
$0.99 – Purchase Checkout
Added to cart