Display Key Metrics with a Minimalist Approach

Product Description
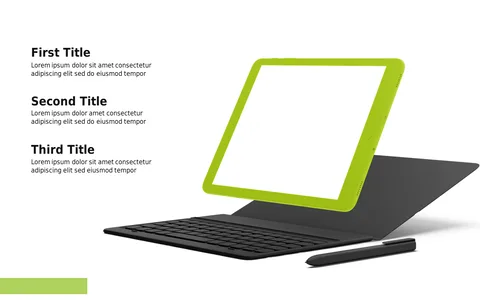
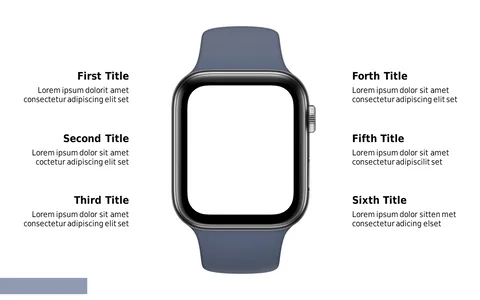
Displaying key metrics can be a daunting task, especially if you want to make sure your audience retains the information. This minimalist slide layout helps you present those metrics clearly, creating a straightforward visual that makes data easier to digest.
Data analysts, marketing specialists, and project managers can use this slide during performance reviews or client presentations. It’s designed to highlight critical numerical information so that everyone walks away with the important takeaways.
For just $0.99, this slide is available for instant download and is ready to customize in both PowerPoint and Google Slides. You’ll be set to present your metrics effectively in no time.
$0.99 – Purchase Checkout
Added to cart
✅ Instant delivery
✅ Fully editable
✅ PowerPoint & Google Slides
Category:
$0.99
Per slide · No minimum · Pay only for what you pick
✓ $0.99/slide
No minimum order
✓ Mix any category
No subscription
Building a full deck?
Mix slides from any of our 58 categories —
all merged into one PowerPoint.
$0.99/slide, no minimum.
Browse All Slides →