Track Project Progress with a Clean Workspace

Product Description
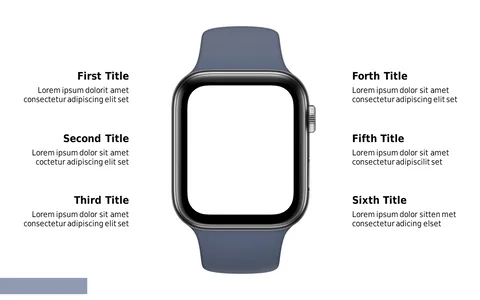
Keeping track of project progress in a visually appealing way can often be a challenge, especially when you want to keep your audience engaged. This clean and minimalist slide enables you to highlight key milestones and indicators clearly, allowing everyone to stay on the same page.
Project managers, software developers, and marketing teams can benefit from this layout during weekly updates or project reviews. Its straightforward design helps you communicate progress efficiently whether you’re in a brainstorming session or a formal report meeting.
For just $0.99, you can download this slide and have it ready in moments. It’s easily editable in both PowerPoint and Google Slides, so you can tailor it to your project specifics and make your presentations shine.
$0.99 – Purchase Checkout
Added to cart