Visualize Concepts with Hexagonal Infographic Style
Product Description
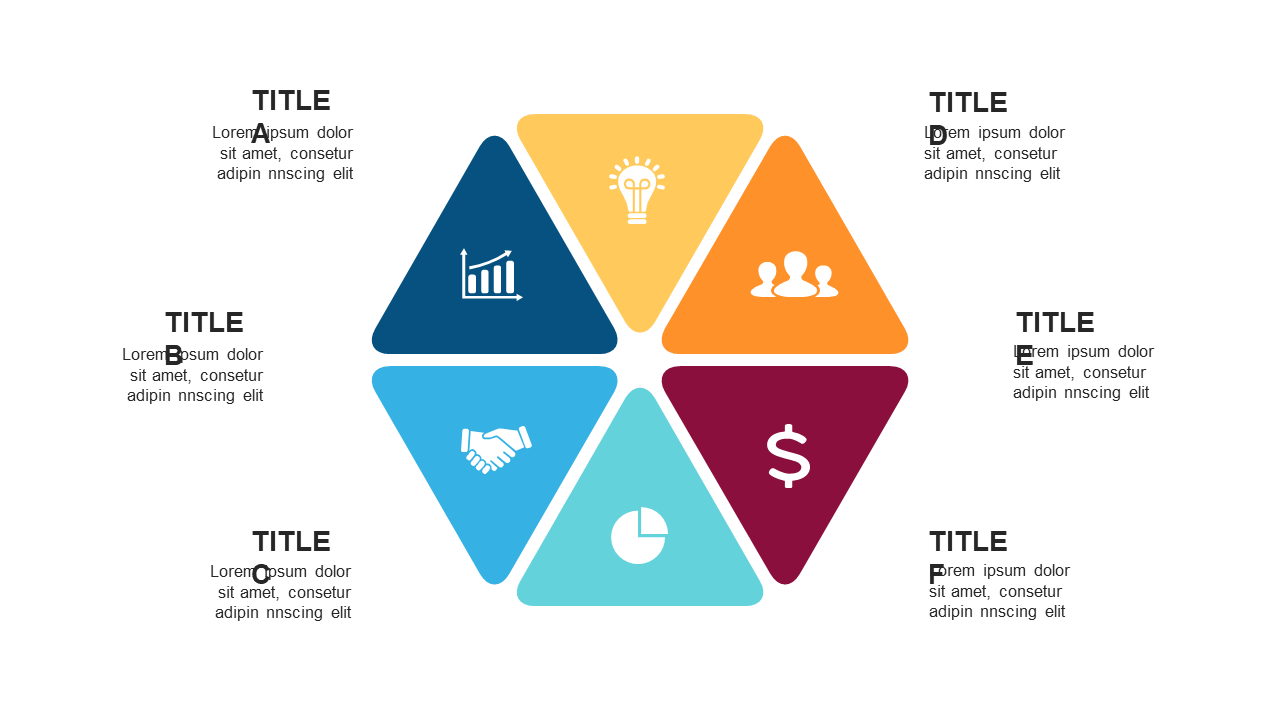
Trying to convey abstract concepts can lead to confusion, but a hexagonal infographic provides a clear structure that enhances understanding. This layout helps you break down complex information into manageable sections that are visually captivating and easy to digest.
Ideal for marketing specialists presenting campaign metrics, project managers outlining project scopes, or educators conveying key principles, this slide works well in various settings. Whether you’re leading a workshop or presenting to clients, it ensures your ideas are clearly articulated and understood.
Get this innovative hexagonal infographic for just $0.99 and have it ready for immediate download. It’s fully editable in PowerPoint and Google Slides, allowing you to customize icons and text to match your presentation style in no time.
$0.99 – Purchase Checkout
Added to cart







