Present 4-Step Startup Process Clearly
Product Description
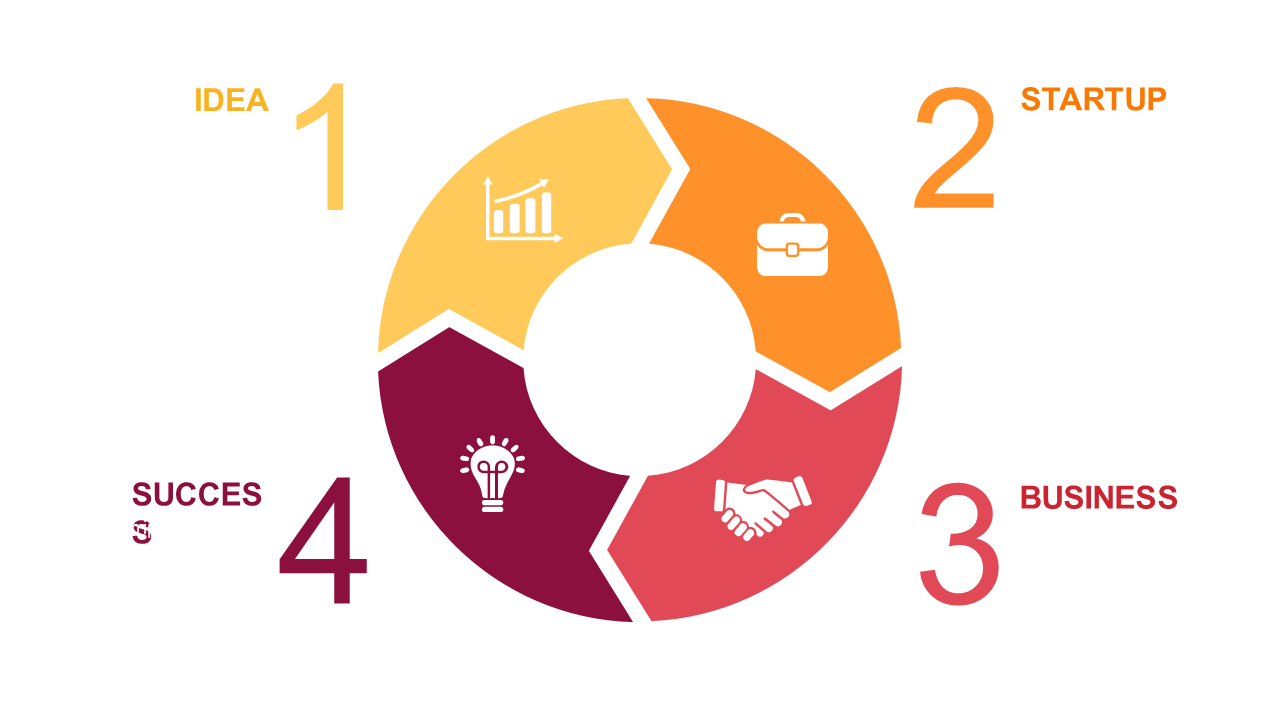
When pitching to investors, clarity is key. Presenting a convoluted startup process can confuse your audience and dilute your message. This slide uses a circular diagram to visualize a four-step startup process: Idea, Startup, Business, and Success. Each segment is clearly defined, making it easy for your audience to follow along and grasp the journey from concept to execution.
An investor can use this slide to succinctly summarize a startup’s growth trajectory, helping them understand the potential for success. A venture analyst may find it essential for breaking down and comparing multiple startups’ processes, making it easier to identify the most promising opportunities. For startup founders, this slide serves as a compelling visual aid during pitches, ensuring that they communicate their vision effectively.
Customization is straightforward; you can edit the segments to reflect your specific process or branding.
$0.99 —
add this single slide to any deck from the SlideSwift Slide Library. No subscription needed. Mix slides from any category to build your perfect deck.
$0.99 – Purchase Checkout
Added to cart