Highlight Business Elements with Triangular Infographic
Product Description
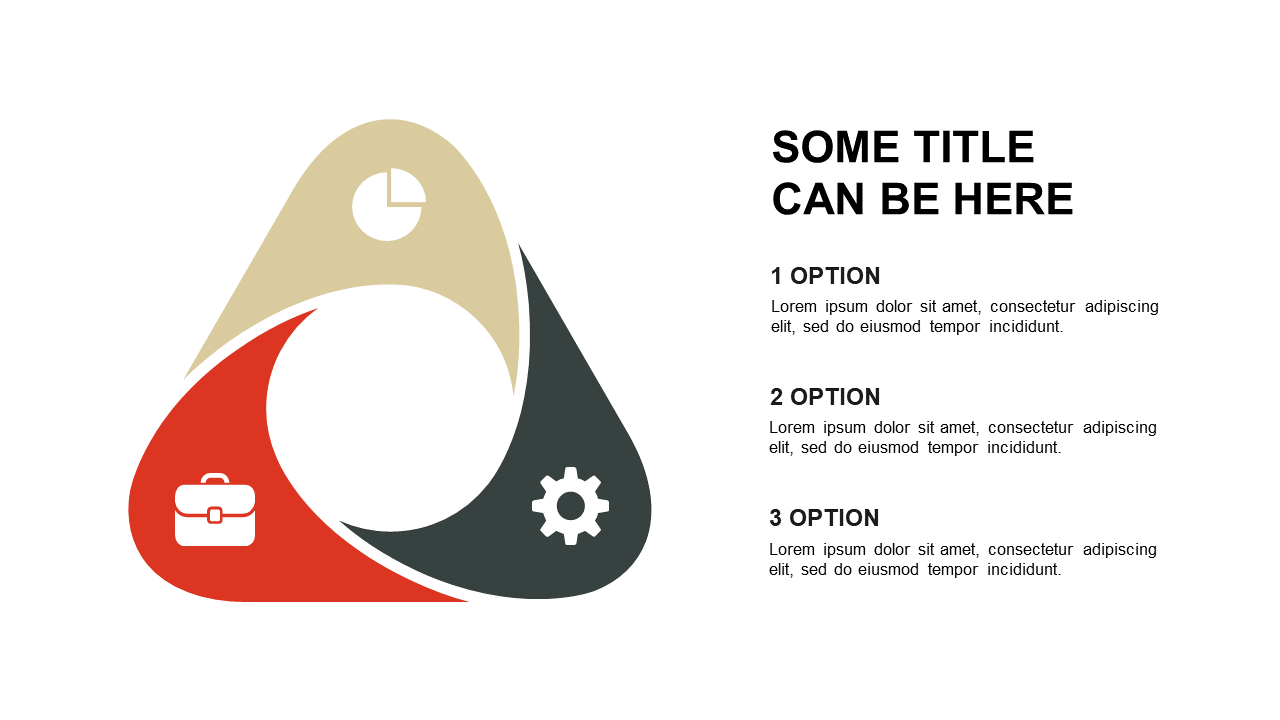
Complex ideas can create confusion during a presentation, especially if the visuals don’t support your message. This triangular infographic clarifies your points by effectively illustrating three essential business elements: management, analytics, and operations.
It guides your audience’s attention and enhances understanding. Ideal for team leaders discussing performance metrics, product managers outlining project components, or consultants presenting business strategies, this slide helps you communicate clearly. With its visually engaging layout, it ensures your audience stays focused on your key messages.
Available for just $0.99, this slide is ready for immediate download. You can quickly edit it in PowerPoint and Google Slides, adapting it to your specific content without any complications.
$0.99 – Purchase Checkout
Added to cart







