Engage Audiences with Circular Process Infographic V2
Product Description
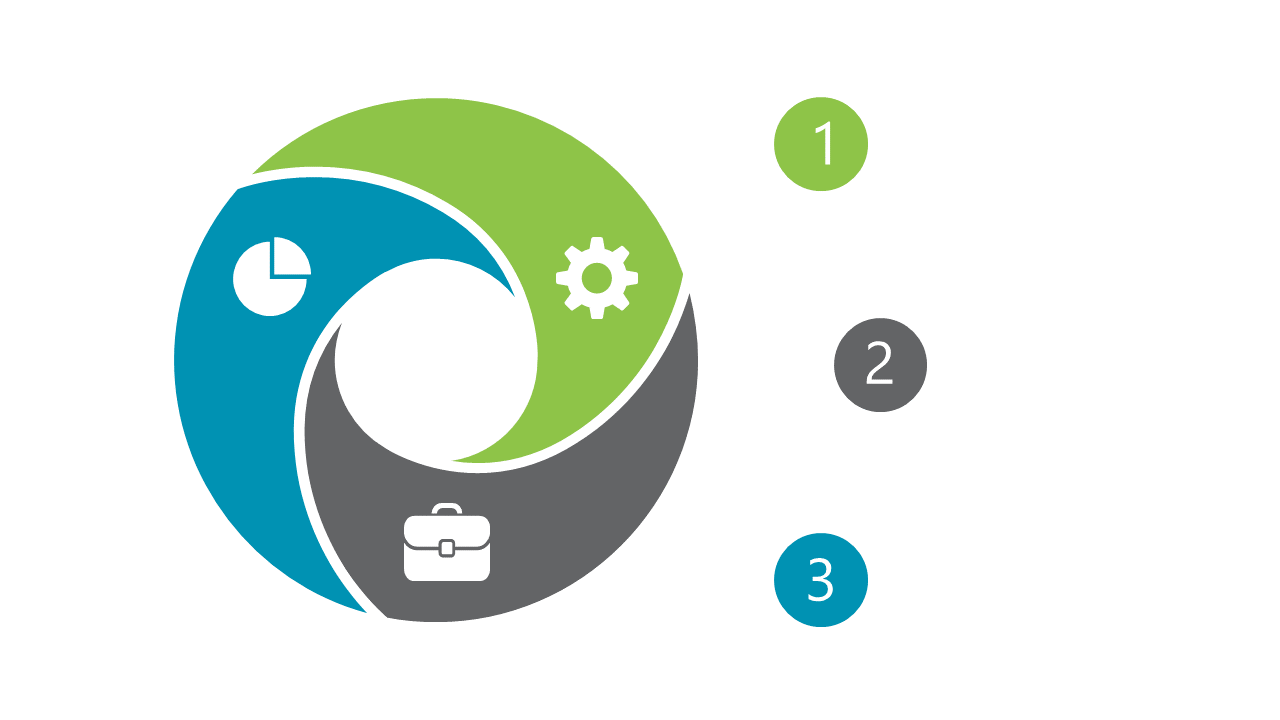
In a fast-paced work environment, conveying complex processes without losing clarity can be challenging. This circular process infographic provides a visually engaging way to present information, breaking down workflows into manageable, digestible segments that stick with your audience.
This slide is ideal for product owners, marketing managers, or training coordinators who need to share intricate processes during workshops, strategy meetings, or onboarding sessions. By simplifying the information, you enhance understanding and retention for your listeners.
Get this slide now for just $0.99, and enjoy an instant download that’s fully editable in PowerPoint and Google Slides. You can have it tailored to your unique needs in just minutes, so you’re ready to deliver your insights effectively.
$0.99 – Purchase Checkout
Added to cart







