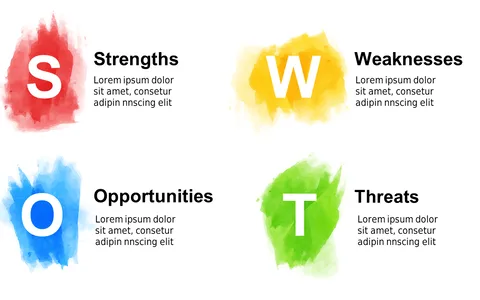
Conduct Strategic Planning with a SWOT Infographic

Product Description
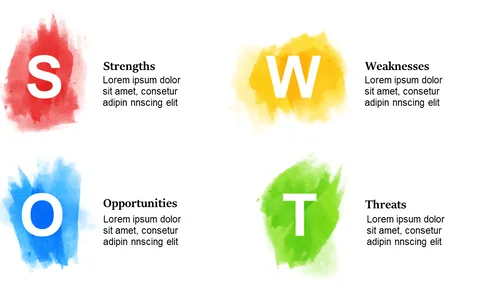
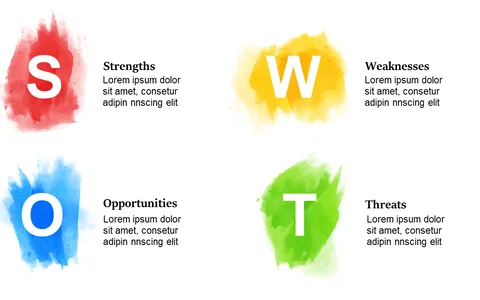
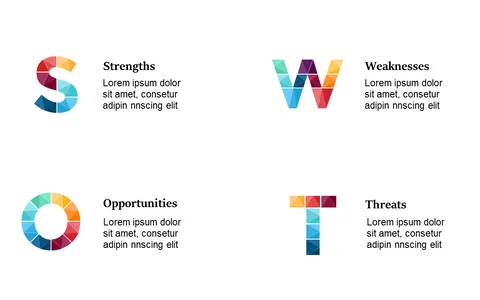
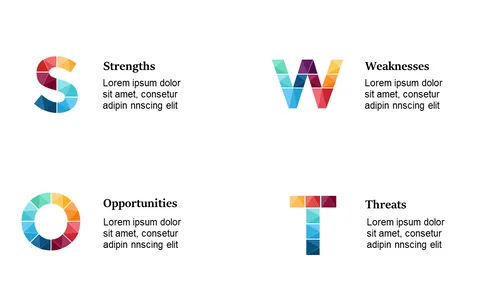
Trying to visualize complex strategic plans can be daunting, and your audience deserves clear insights. When you’re tasked with conducting a SWOT analysis, this infographic slide is your go-to tool for presenting strengths, weaknesses, opportunities, and threats in a concise manner.
It transforms dense data into digestible segments, paving the way for informed discussions. Strategic planners, business analysts, and marketing professionals can rely on this slide during team workshops, strategy sessions, or board meetings to facilitate meaningful conversations. By visually breaking down the SWOT components, you ensure that everyone maintains focus on the crucial elements of your strategy.
Available for just $0.99, this slide is instantly downloadable and easy to edit. You can modify it in PowerPoint or Google Slides, allowing you to ready your findings in no time.
$0.99 – Purchase Checkout
Added to cart