Visualize 6-Step Processes with Engaging Infographics
Product Description
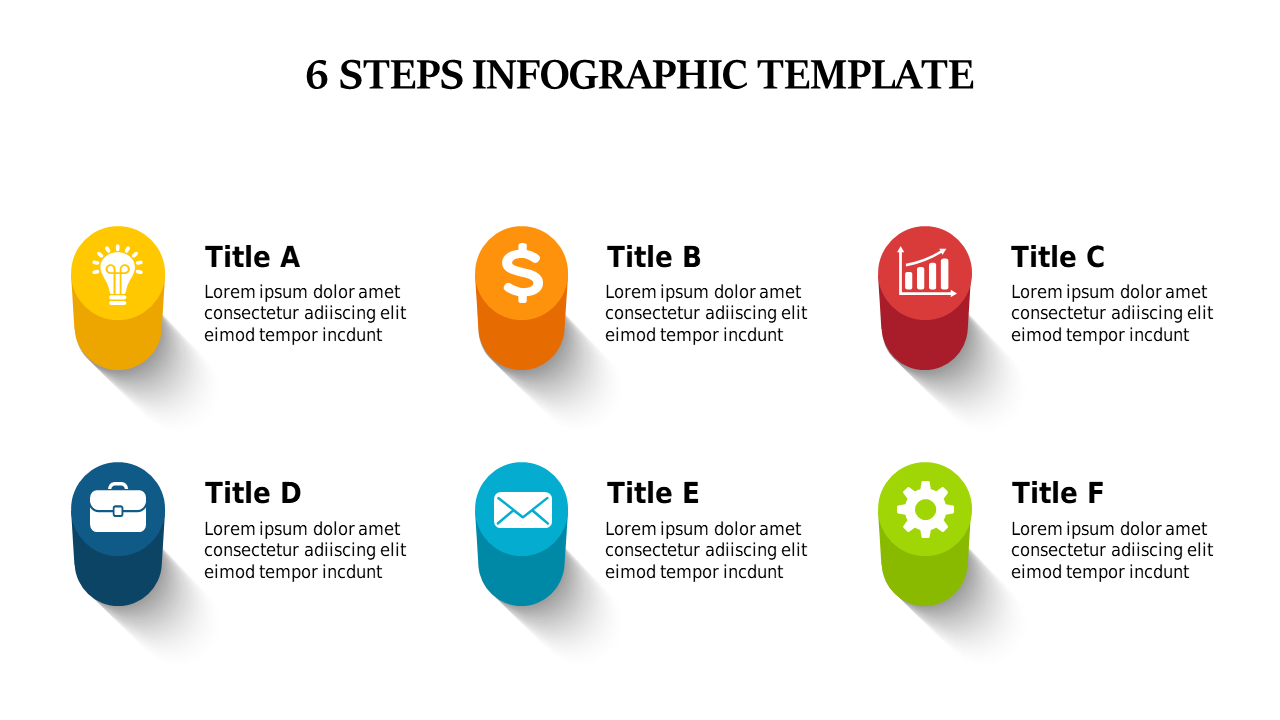
Overwhelming your audience with complex information can lead to disengagement. This slide allows you to visualize a 6-step process using engaging icons and clear text, helping your audience follow along with ease and comprehension.
Great for consultants presenting strategic plans or operations teams discussing workflow efficiencies, this slide is perfect for any scenario needing clear process representation. Use it during client presentations or internal reviews to make concepts more accessible.
You can download this slide for just $0.99, and it’s instantly ready for use. Fully editable in PowerPoint and Google Slides, you can tailor it to your specifications in minutes.
$0.99 – Purchase Checkout
Added to cart
✅ Instant delivery
✅ Fully editable
✅ PowerPoint & Google Slides
Category:
$0.99
Per slide · No minimum · Pay only for what you pick
✓ $0.99/slide
No minimum order
✓ Mix any category
No subscription
Building a full deck?
Mix slides from any of our 58 categories —
all merged into one PowerPoint.
$0.99/slide, no minimum.
Browse All Slides →







