Highlight Two-Step Processes with Colorful Infographics
Product Description
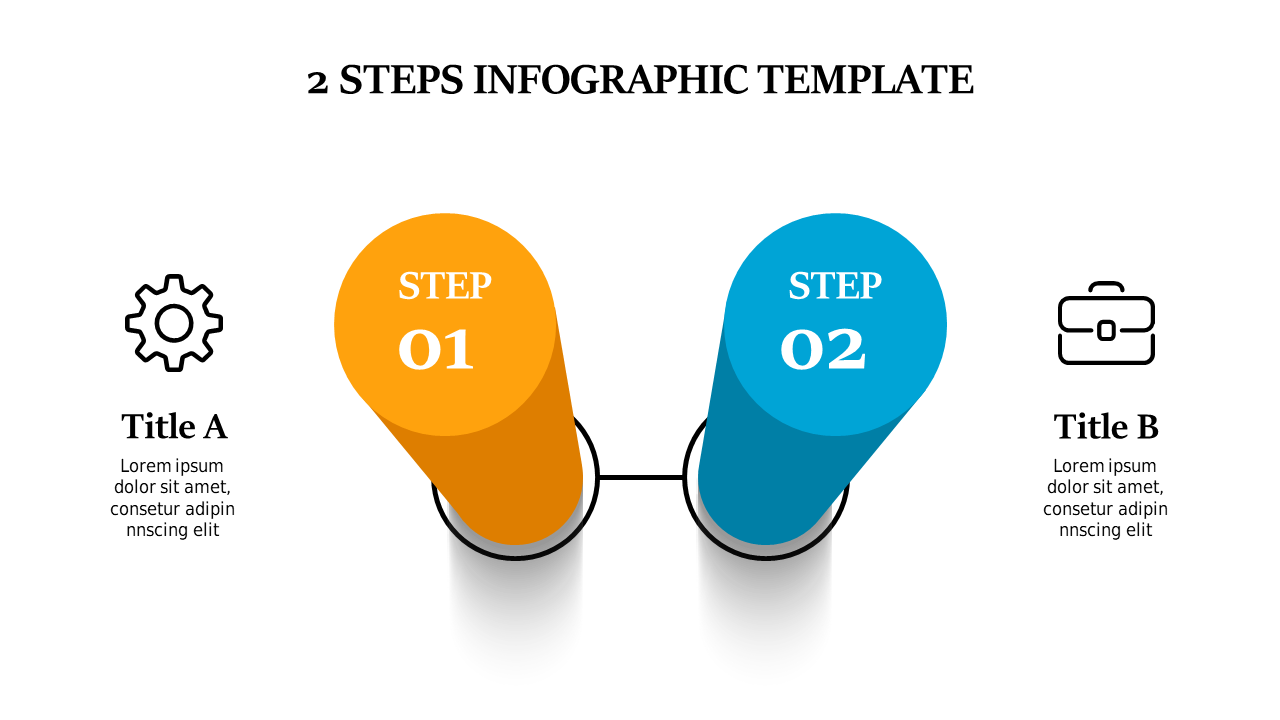
Communicating complex ideas is challenging when clarity is essential, and this slide can help eliminate confusion. It features a visually striking infographic that simplifies a two-step process using colorful cylinders and relevant icons, ensuring your message stands out while remaining easy to understand.
Marketing professionals, educators, and consultants will find this slide particularly useful during client presentations, workshops, or training sessions. Whether you’re illustrating a marketing funnel or demonstrating a training process, this engaging infographic makes your presentation impactful and memorable.
For just $0.99, you can download this slide instantly and customize it in PowerPoint or Google Slides. Editing is straightforward, so you can adapt it to your specific needs and have a polished presentation ready in minutes.
$0.99 – Purchase Checkout
Added to cart







