Present Data with Cylindrical Icons and Percentages
Product Description
Struggling to showcase important statistics in a visually engaging manner is a common challenge. You need to capture your audience’s attention while providing them with the critical information they need.
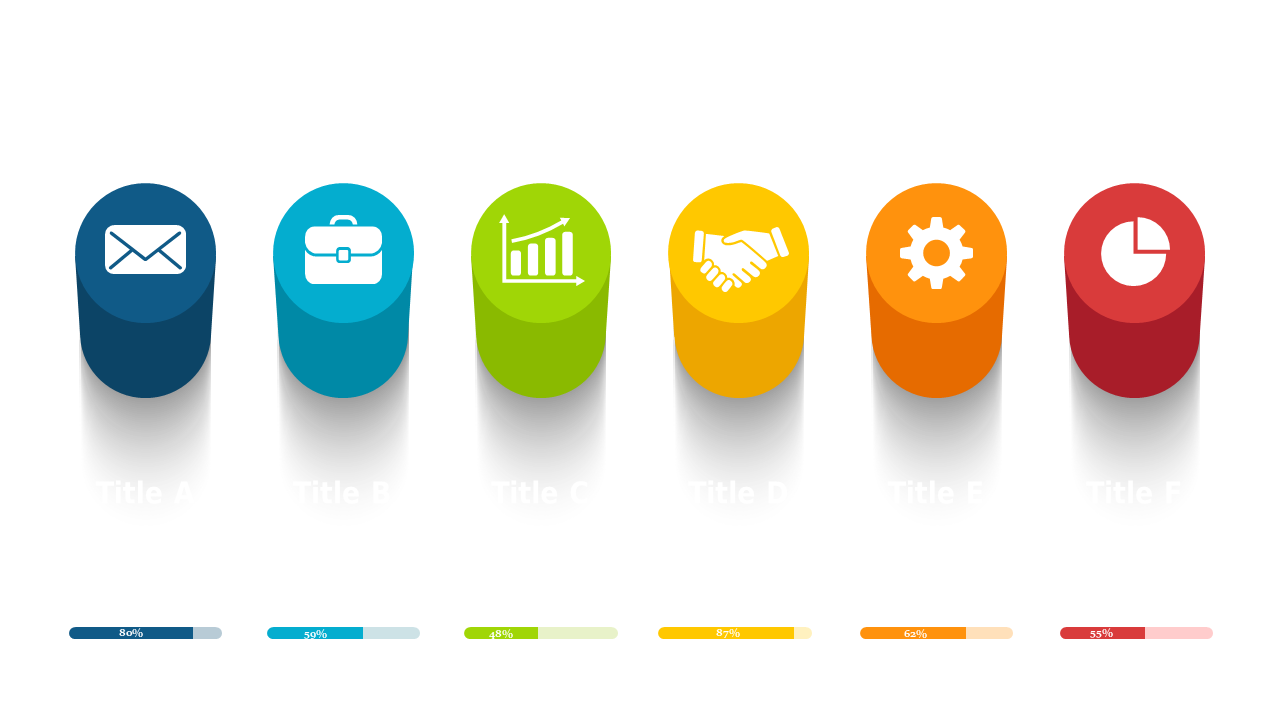
This slide helps you articulate data clearly through the use of vibrant cylindrical icons and percentage indicators. Data analysts, product managers, and operations professionals will find this slide particularly useful during performance updates, project proposals, or client briefings. The engaging visuals not only make data more compelling but also facilitate a better understanding of your key insights.
For just $0.99, this slide can be downloaded instantly and is easy to edit in PowerPoint and Google Slides. You’ll be able to customize it quickly, ensuring your presentation stands out without much effort.
$0.99 – Purchase Checkout
Added to cart







