Showcase Interconnected Concepts with Icons
Product Description
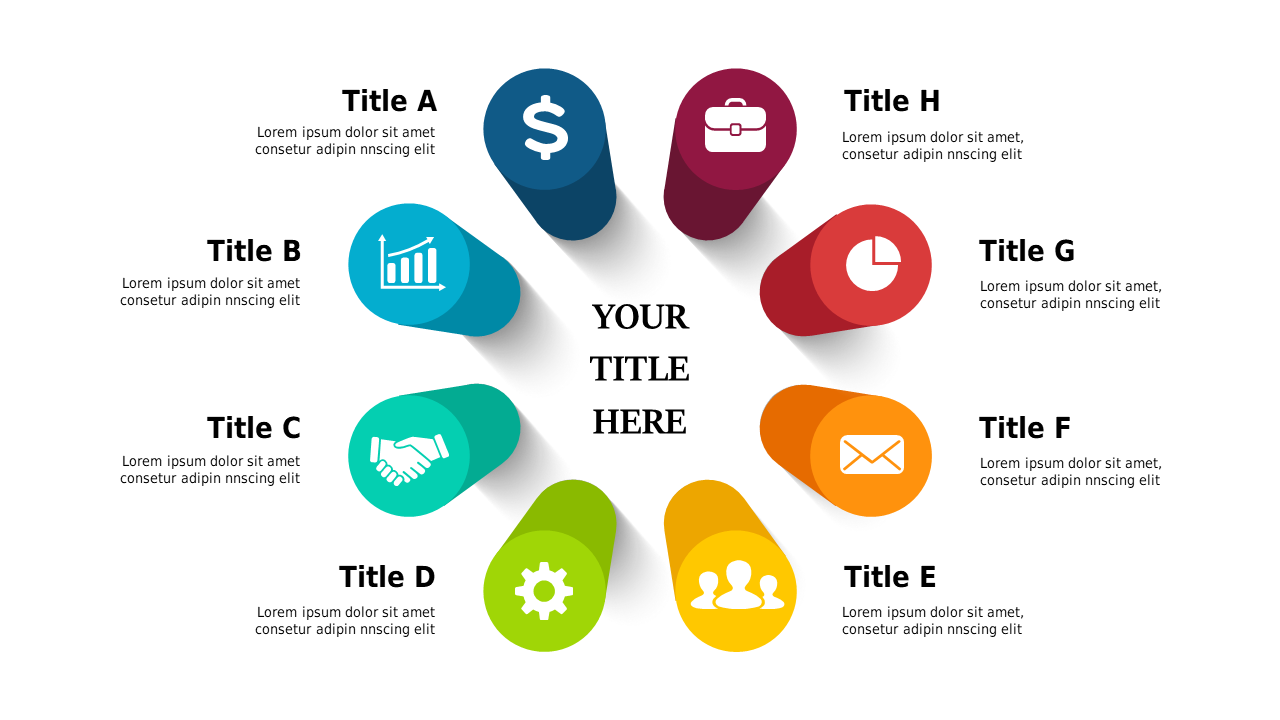
In a sea of presentations, making interconnected concepts clear can often be a challenge. This slide provides a clean, visually appealing circular arrangement of icons, each representing a different idea while connecting them together.
It’s designed to help your audience quickly understand the relationships between your concepts. This slide is perfect for strategic planners presenting a new business model, educators outlining lesson plans, or marketers explaining campaign elements. Whether you’re in a conference room or a virtual meeting, these visuals will help clarify your message and engage your audience effectively.
At just $0.99, this slide is ready for instant download and can be easily edited in PowerPoint and Google Slides. With simple customization options, you can make it your own and prepare a polished presentation in mere minutes.
$0.99 – Purchase Checkout
Added to cart







