Present Brand Performance with Waterfall Chart
Product Description
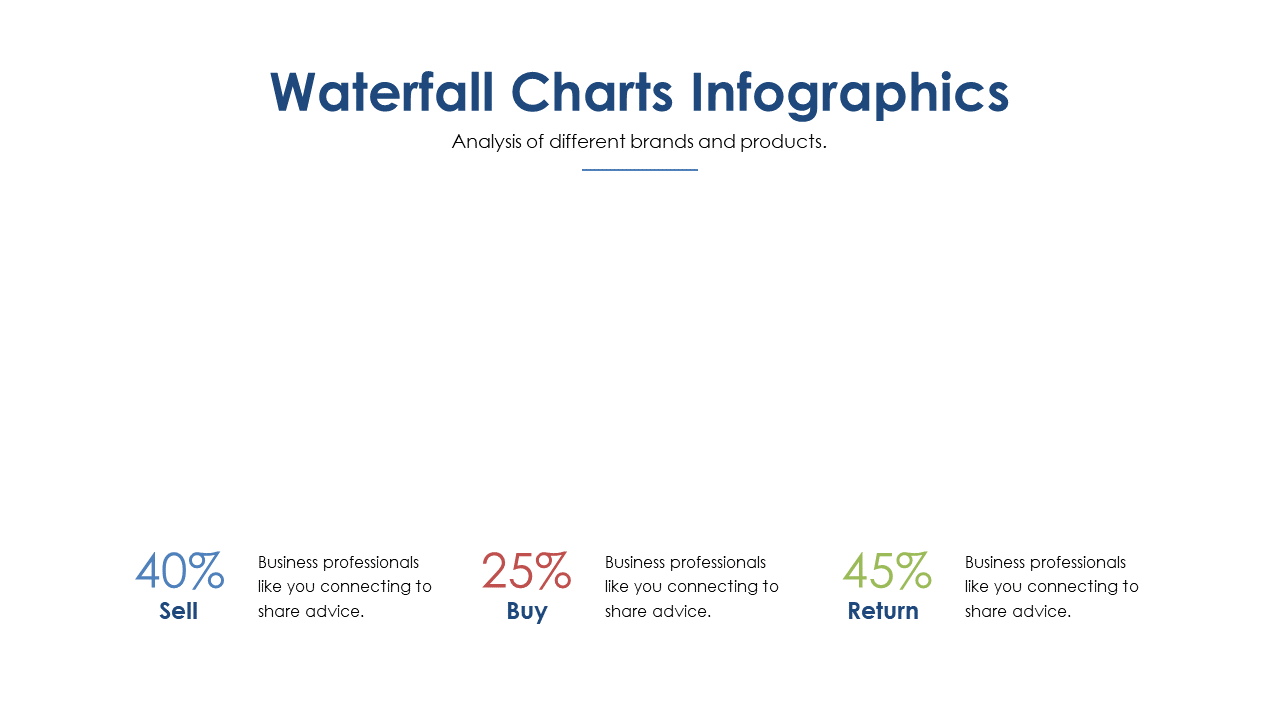
Understanding brand performance can be overwhelming when faced with a mountain of data. This Waterfall Chart slide simplifies those complexities, allowing you to present essential insights that your audience can quickly grasp without getting lost in details.
It ensures clarity in your presentations, making it easy for everyone to see how various factors contribute to brand performance. This slide is perfect for brand managers presenting quarterly performance reviews, marketing professionals analyzing campaign effectiveness, or sales directors comparing product lines. Whether you’re discussing changes in market position during a board meeting or reporting back to your team, this slide gives you the clarity you need to make impactful presentations.
Available for just $0.99, this slide is ready for you to download instantly. You can easily edit it in both PowerPoint and Google Slides, making customization a breeze and ensuring you can tailor it to your specific needs in minutes.
$0.99 – Purchase Checkout
Added to cart







