Engage Audience with Waterfall Chart for Brand Analysis
Product Description
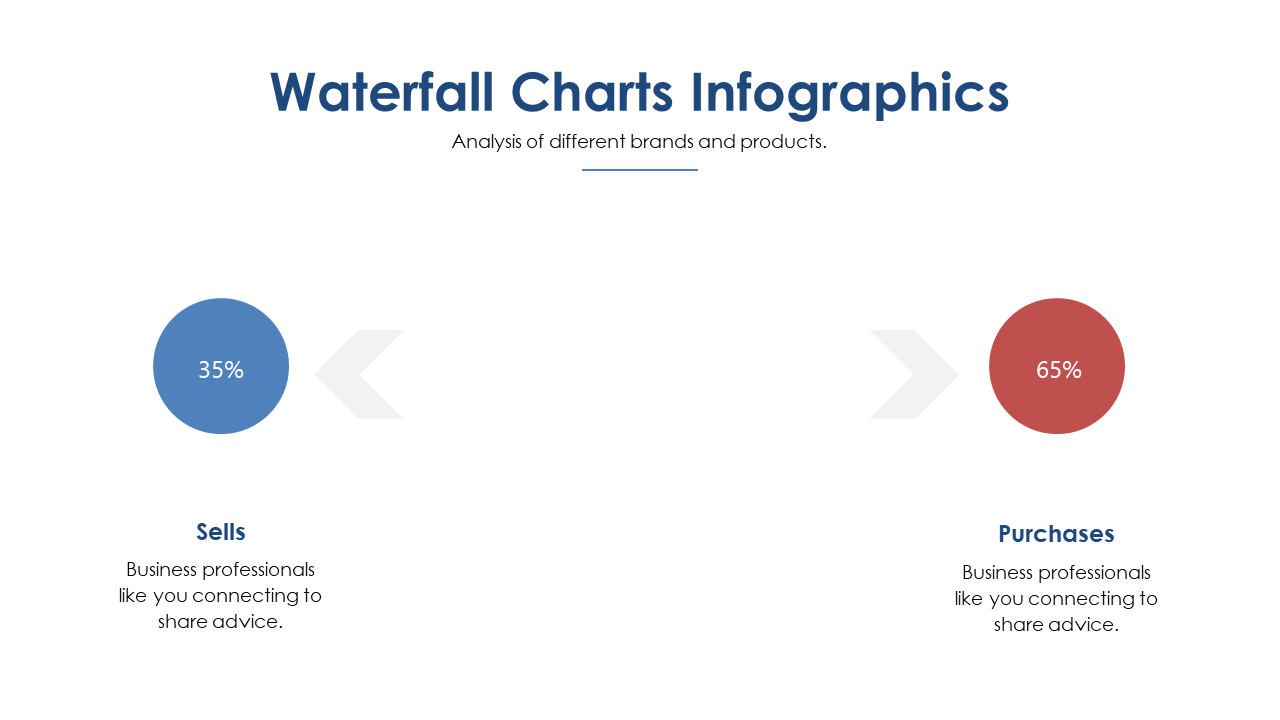
Making complex data understandable can be a daunting task, especially when trying to engage your audience. This waterfall chart slide provides a straightforward design that highlights performance trends, breaking down intricate information into digestible visuals.
Content strategists preparing reports for stakeholders, marketing directors analyzing campaign results, or product owners evaluating feature effectiveness will find this slide invaluable. It helps you present your findings in an engaging way that invites discussion and insight.
For only $0.99, this slide is an instant download and can be easily edited using PowerPoint or Google Slides. You’ll be able to enhance your presentations with high-quality visuals in no time.
$0.99 – Purchase Checkout
Added to cart







