Clarify Business Phases with Venn Diagram
Product Description
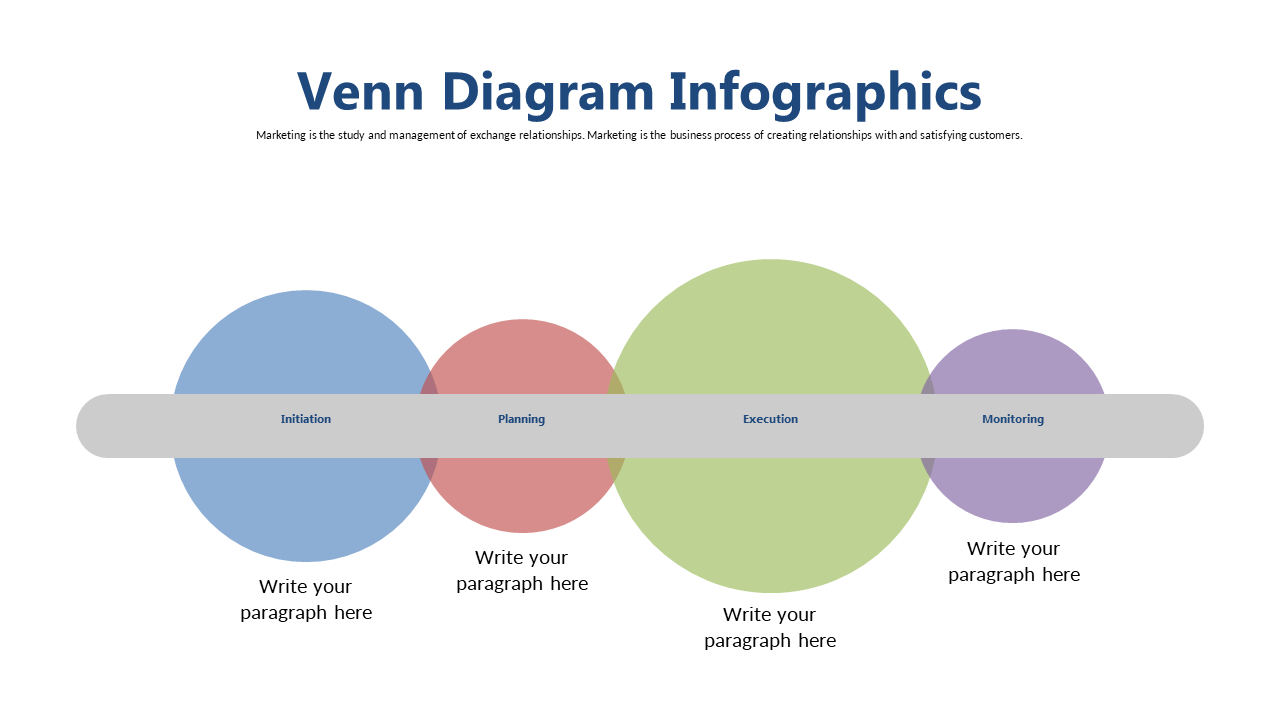
Communicating the phases of a project can often be a daunting task, especially when trying to ensure that everyone is on the same page. This Venn diagram helps clarify the relationships between different project phases like Initiation, Planning, and Execution, making complex information easier to digest.
This slide is perfect for project managers, team leads, and consultants who need to illustrate processes in meetings, training sessions, or project kick-offs. It will help your team visualize how each phase influences one another, fostering better collaboration and understanding.
For just $0.99, you can download this slide instantly, and it’s fully editable in PowerPoint and Google Slides.
You can customize it to suit your specific project needs without spending hours on design.
$0.99 – Purchase Checkout
Added to cart







