Illustrate Startup Concepts with Circular Diagram
Product Description
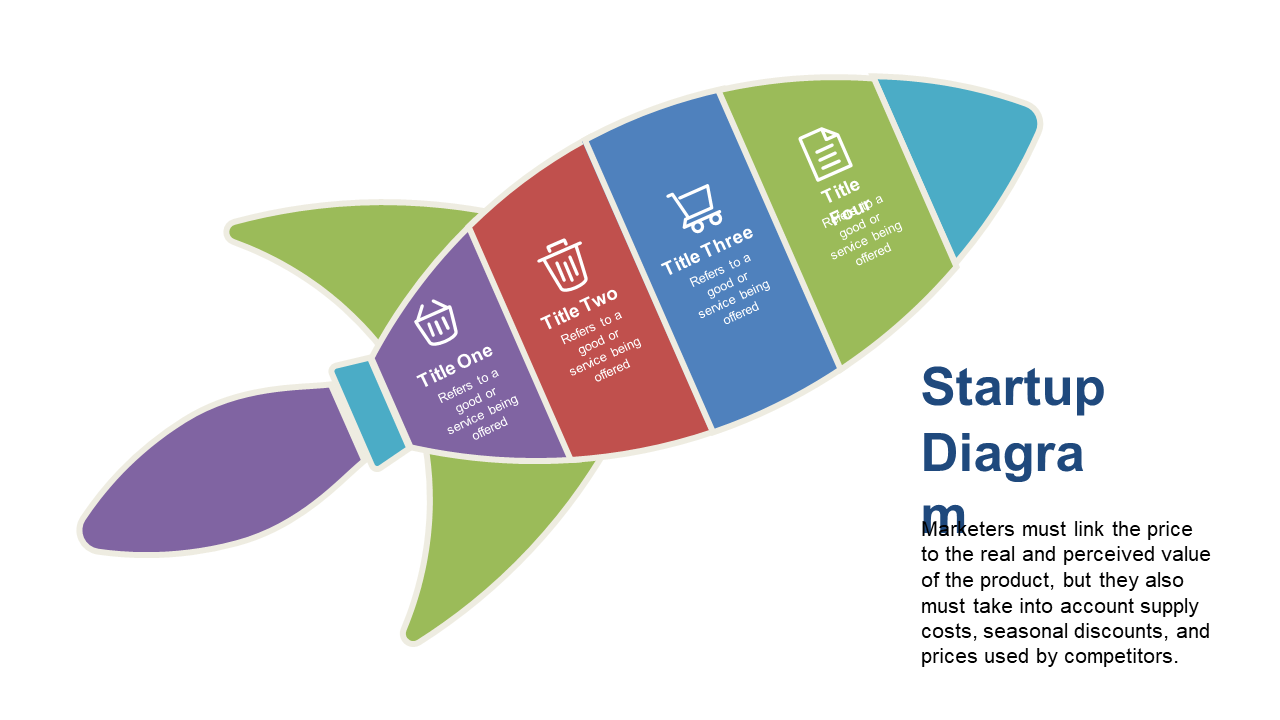
Finding the right way to explain complex startup concepts can be overwhelming, especially when your audience needs quick clarity. This circular diagram makes it easier to communicate the essential phases of your startup, helping you convey your message clearly and effectively. With a visual that catches the eye, you can engage investors, team members, or even potential partners more compellingly.
Startup founders, pitch deck creators, and business consultants can benefit from this slide during meetings, pitch competitions, or strategy sessions. Use it to showcase your startup journey, from ideation to market entry, making every key phase stand out to your audience. This diagram is perfect for anyone looking to simplify complex ideas into digestible visuals.
For just $0.99, you can download this slide instantly and start editing it right away in PowerPoint or Google Slides.
Easily customize the colors and text to fit your brand, making your presentation ready in minutes.
$0.99 – Purchase Checkout
Added to cart