Engage Audience with Colorful Rocket Startup Diagram
Product Description
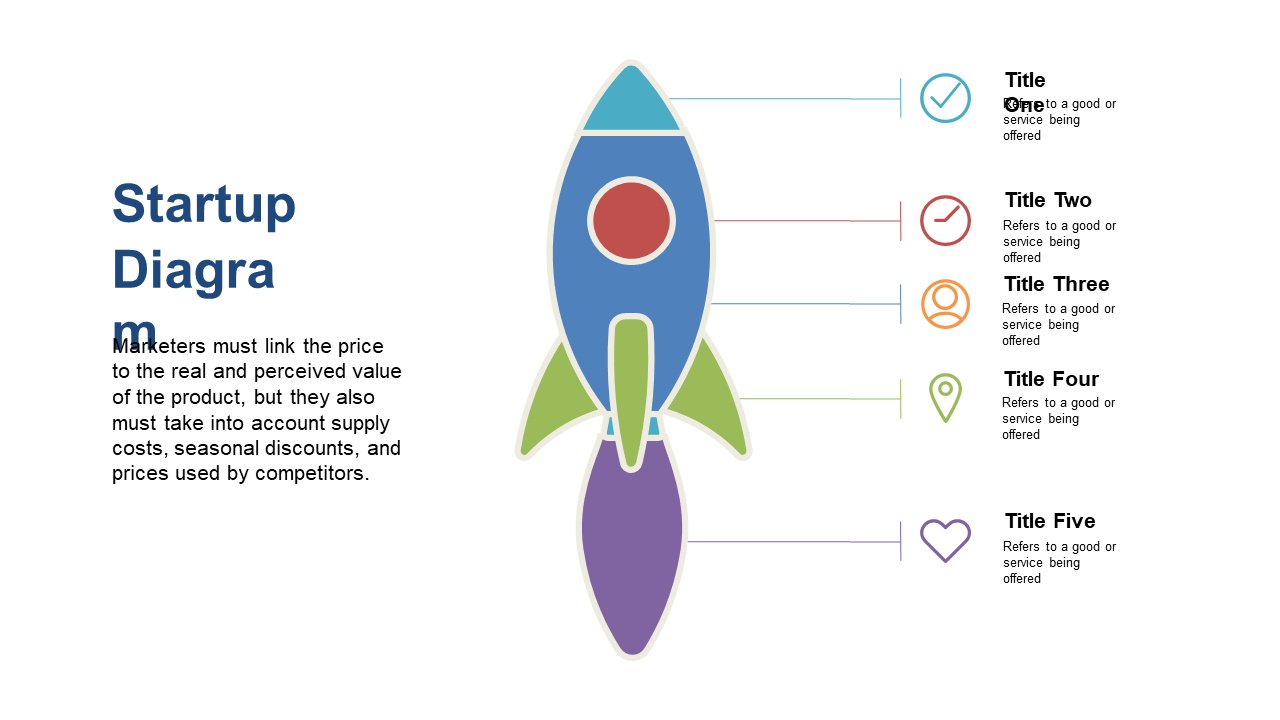
In the fast-paced world of startups, capturing your audience’s attention is crucial. When you’re presenting ideas, data, or strategies, having a visually engaging slide can make all the difference. This vibrant rocket startup diagram not only depicts growth but also embodies innovation, making it perfect for your next PowerPoint presentation. With colorful sections, this slide allows you to showcase product pricing strategies alongside competitive analyses. It’s designed to grab attention and deliver your message effectively.
As a startup founder, you can use this slide to highlight key growth metrics during pitches. Entrepreneurs can incorporate it when discussing market positioning and strategic initiatives. Investors may find it useful for illustrating potential returns on investment in a visually appealing way. The editable sections allow for seamless customization, ensuring that your specific data and branding are front and center.
$0.99 —
add this single slide to any deck from the SlideSwift Slide Library. No subscription needed. Mix slides from any category to build your perfect deck.
$0.99 – Purchase Checkout
Added to cart