Creative Science Infographic with Circular Elements
Product Description
Conveying intricate scientific concepts can often lead to confusion, making your audience tune out. You need a way to keep them engaged while ensuring they grasp the essential points.
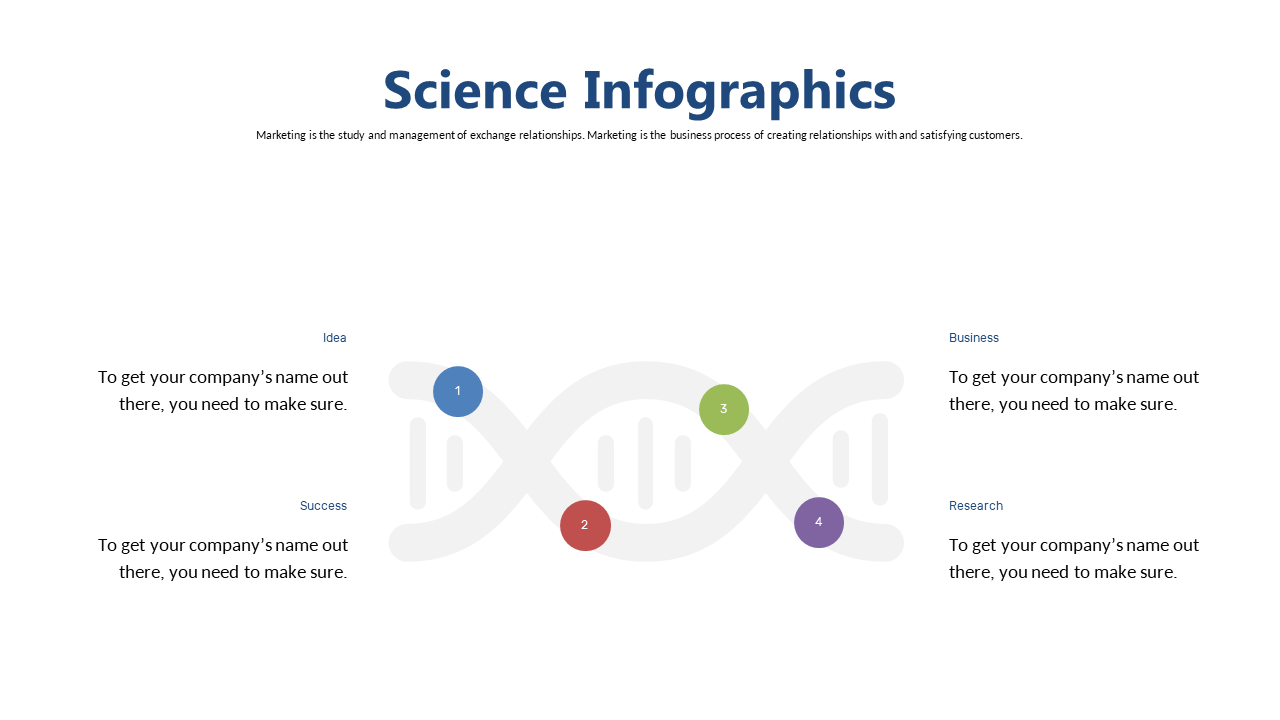
This creative science infographic, with its circular elements, offers a visually striking solution to present your information clearly and attractively. Ideal for researchers, educators, and professionals in the science and technology sectors, this slide is perfect for classroom presentations, conference pitches, or project updates. Its vibrant colors and clean layout help you illustrate complex ideas while maintaining your audience’s interest.
For only $0.99, this slide is an instant download that you can edit easily in PowerPoint and Google Slides. Get started on making your scientific presentations not just informative, but also visually appealing.
$0.99 – Purchase Checkout
Added to cart







