Circular Flow Infographic for Complex Relationships
Product Description
When tasked with presenting complex relationships, a well-crafted visual can be your best ally. You need a way to illustrate intricate processes that your audience can easily follow.
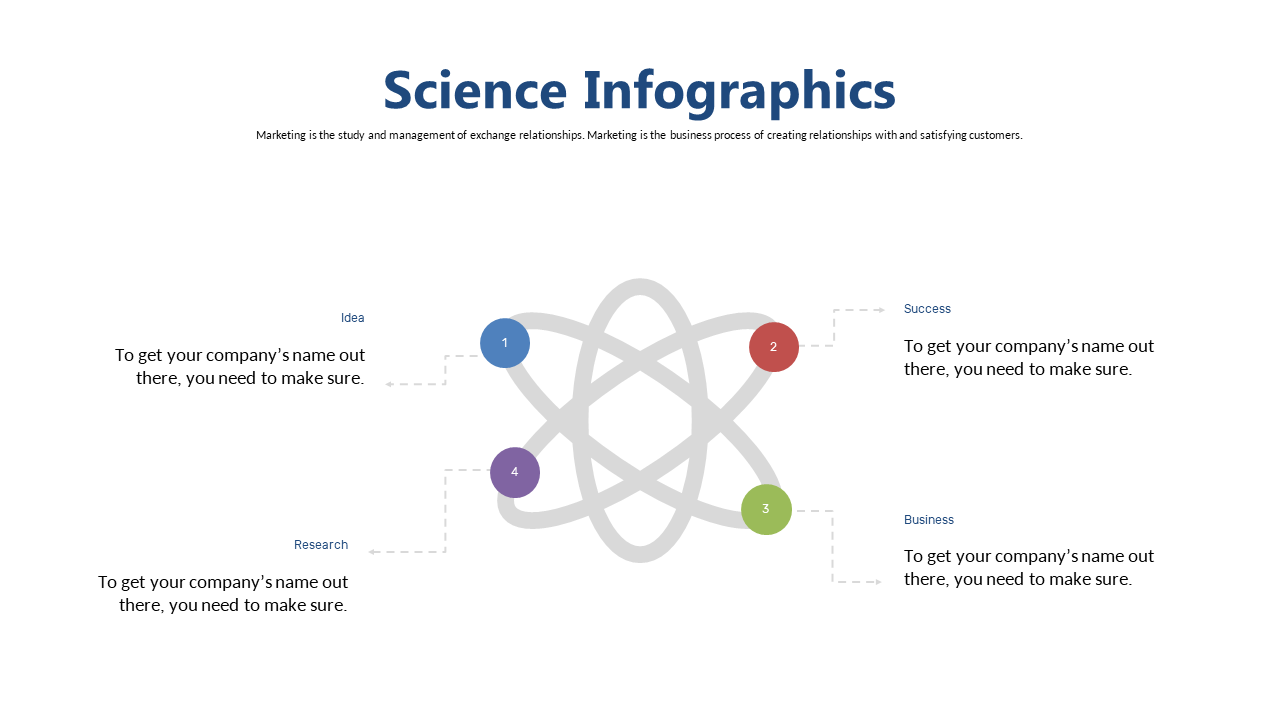
This circular flow infographic presents labeled data points in a manner that keeps your message clear and understandable. Imagine this slide in use when you’re a business analyst outlining product life cycles, a project manager explaining the flow of tasks during a project, or an educator teaching concepts of systems thinking. Each scenario benefits from a visual aid that simplifies complexity.
Download this infographic for just $0.99, and it’s yours to modify in PowerPoint and Google Slides. You’ll find it easy to edit, and it’ll be ready for your next meeting in just minutes.
$0.99 – Purchase Checkout
Added to cart







