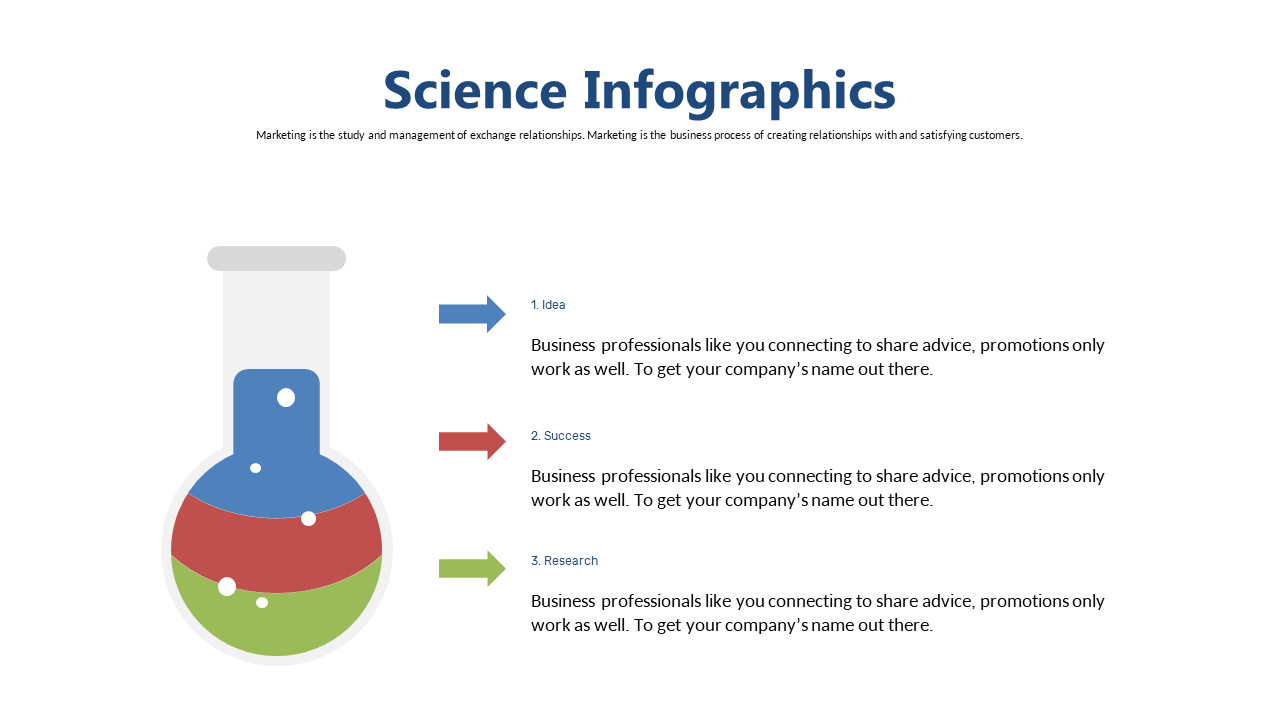
Vibrant Science Infographic with Stepwise Arrows
Product Description
Navigating complex scientific concepts can often leave your audience puzzled and disengaged. You need a way to present your findings or processes that captures attention while simplifying the information.
This vibrant science infographic, complete with stepwise arrows, is designed to bridge that gap and engage your viewers. Consider using this slide if you’re a research scientist presenting your latest findings, an educator introducing a new laboratory technique, or a project manager explaining a multi-step process to your team. It’s perfect for science conferences, academic presentations, or any meeting where clarity is key to understanding intricate topics.
For just $0.99, you can download this eye-catching infographic, which is fully editable in PowerPoint and Google Slides. You’ll have the slide ready for use in minutes, allowing you to focus more on your content and less on the design.
$0.99 – Purchase Checkout
Added to cart







