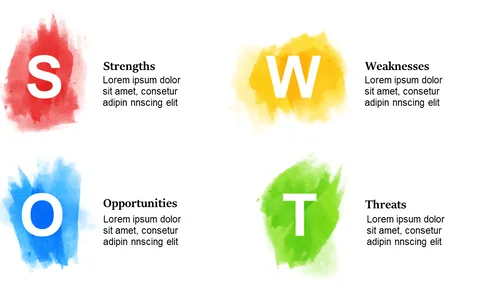
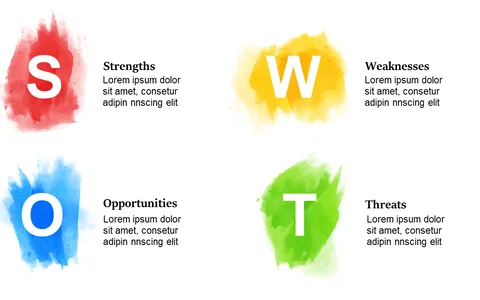
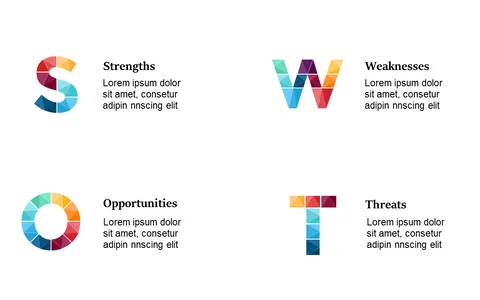
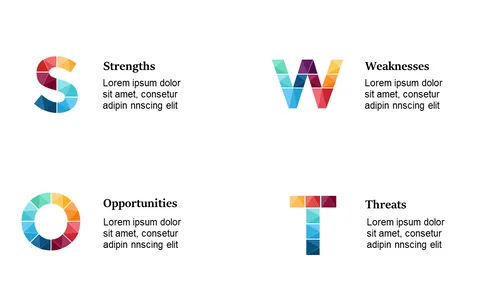
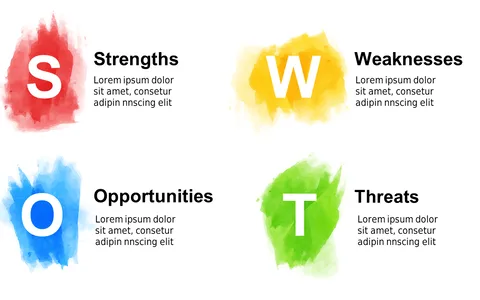
Engaging Circular Diagram for SWOT Analysis
Product Description
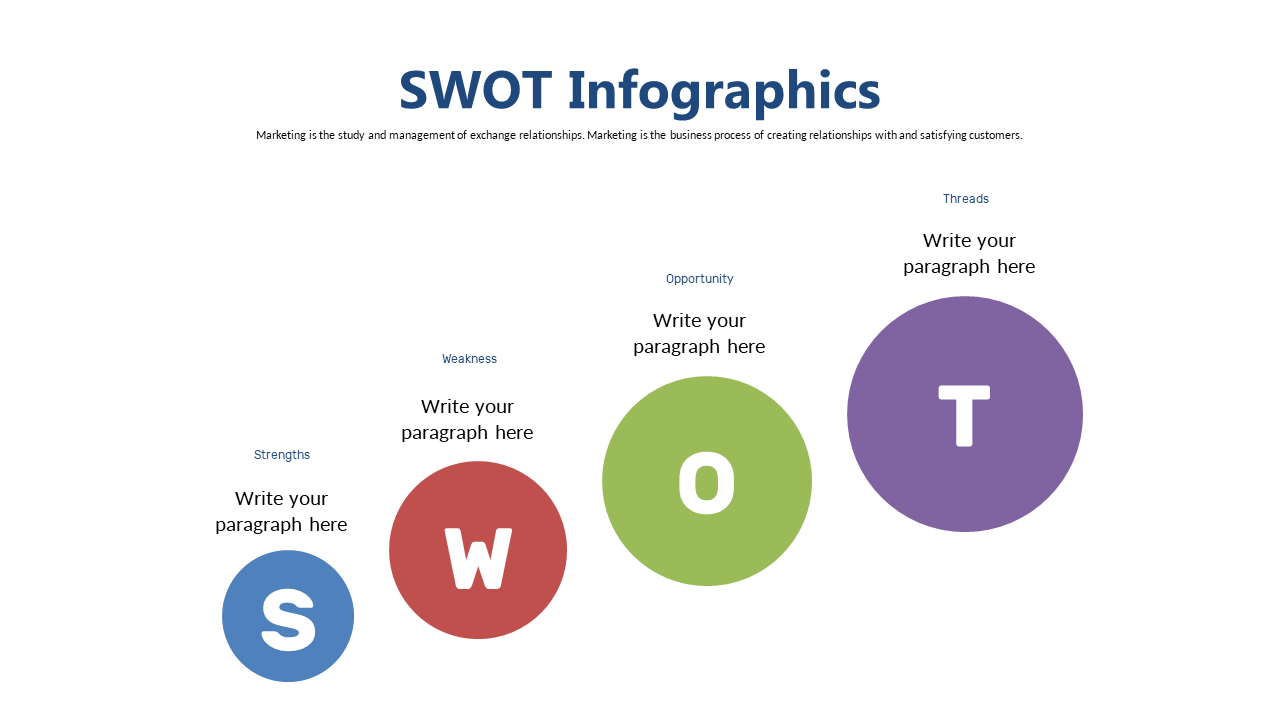
Complicated strategic decisions often require a fresh perspective, yet traditional SWOT formats can fall short in engaging your audience. This circular diagram brings a dynamic visual flair to your analysis, helping you present strengths, weaknesses, opportunities, and threats in an engaging manner.
Make dry data come alive with this modern layout. Consultants, marketing strategists, and project managers will find this slide beneficial during team brainstorming sessions or when delivering project updates. It’s particularly effective during workshops where creative input and collaboration are essential, allowing everyone to visualize the analysis easily.
For only $0.99, you can download this slide and start editing it effortlessly in PowerPoint or Google Slides. Get ready to captivate your audience with a presentation that combines clarity and engagement in minutes.
$0.99 – Purchase Checkout
Added to cart