Engage with Circular Roadmap Infographic

Product Description
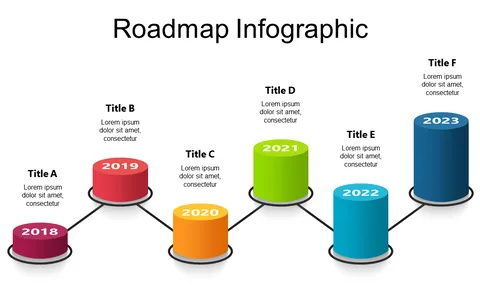
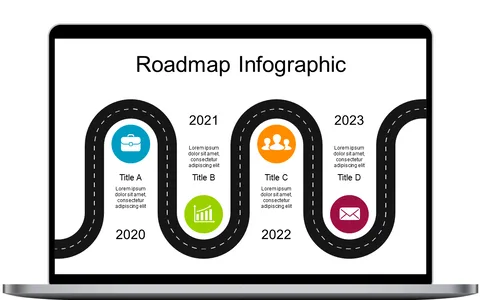
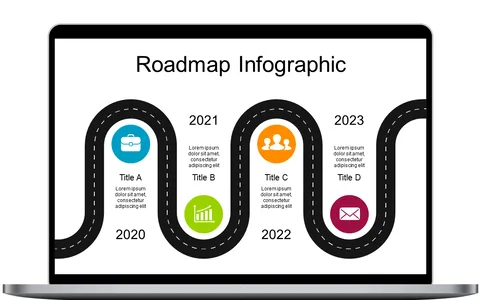
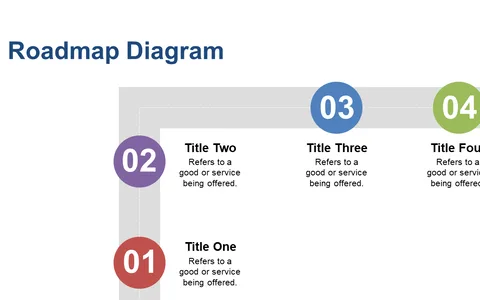
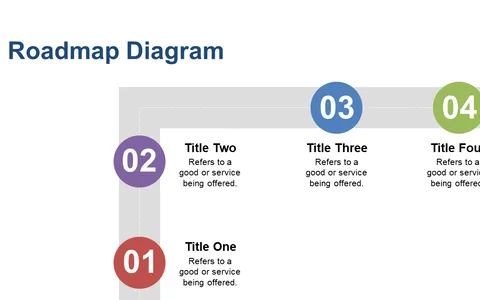
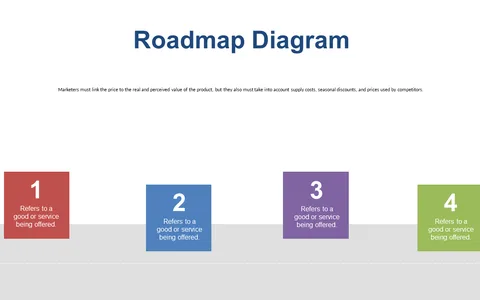
When your time is short and you need to present a project timeline, clarity is key. This circular roadmap infographic transforms complex progressions into easily digestible visuals, ensuring your audience grasps the crucial milestones without getting lost in details.
This slide is perfect for project managers in tech or marketing who are delivering updates in quarterly review meetings. Whether you’re outlining the steps in a product launch or detailing a marketing campaign’s timeline, this visual tool can help ensure everyone stays on the same page.
For just $0.99, you can download this slide instantly. It’s fully editable in both PowerPoint and Google Slides, making it easy to customize for your needs and ready to use in minutes.
$0.99 – Purchase Checkout
Added to cart