Visual Roadmap with Sequential Markers

Product Description
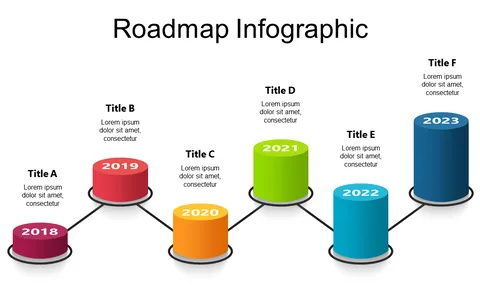
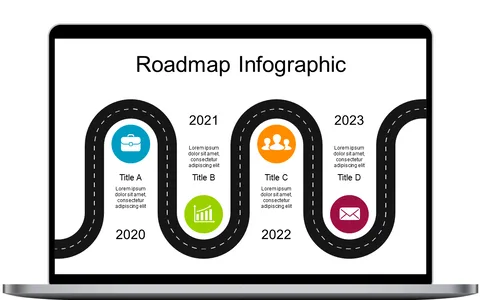
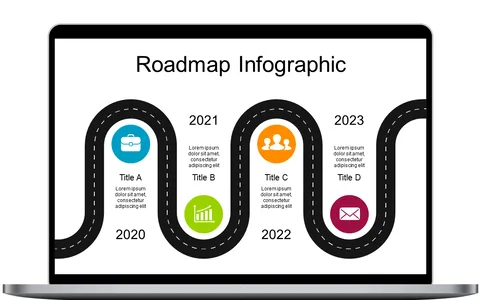
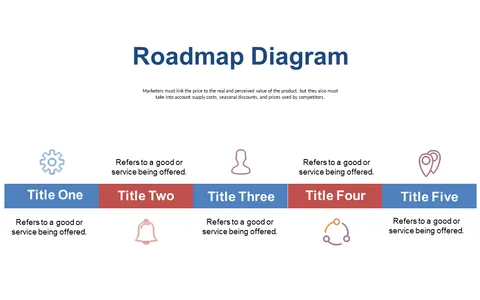
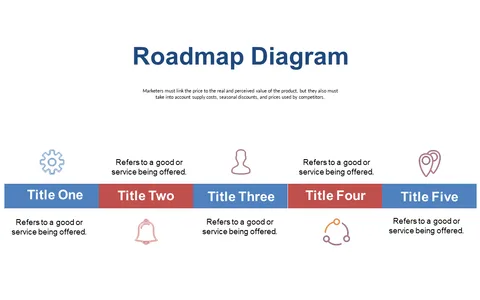
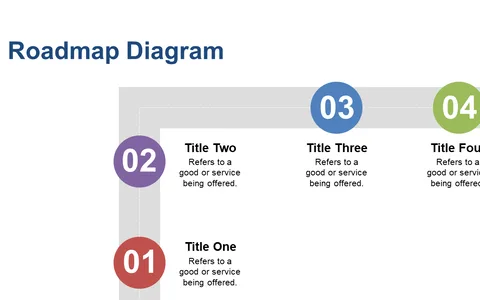
Clearly outlining project milestones can be a daunting task, especially when your audience needs to understand timelines at a glance. This visual roadmap slide, featuring sequential markers, presents a structured overview of your project’s flow, allowing everyone to see progress and upcoming tasks easily.
It transforms your project timeline into a visually engaging format that fosters comprehension. This slide fits perfectly for product managers, operations directors, or team facilitators who aim to clarify timelines during stakeholder meetings or planning sessions. By using this slide, you can effectively communicate your project’s status and keep your audience engaged throughout your presentation.
For just $0.99, you can download this slide instantly and make edits in PowerPoint or Google Slides. It’s easy to personalize, allowing you to get your presentation ready in a matter of minutes.
$0.99 – Purchase Checkout
Added to cart